GNSS Time Series Notes
Ground Deformation Parameters
Daily solutions are available as data extracts and plots using Tilde services.
Output from the Tilde Data endpoint
For each site, a JSON or CSV -formatted data is available, containing the East, North and Up coordinate differences with respect to the reference position.
JSON structure
Data object
{
    "ts"  : "string", # The date-time of the observation in ISO8601 format, UTC time zone;

    "val" : "number", # The observation value, representing the displacement (north, east or up) from a reference position (in meters);

    "err" : "number", # The observation error, representing the displacement (north, east or up) standard deviation (in meters);

    "qc"  : "string", # The observation's quality control flag;
}
CSV formatting
- Columns 1-6 are the domain, station, name, sensor code, method, and aspect of the observation;
- Column 7 is the date-time of the observation in ISO8601 format, UTC time zone;
- Coulmn 8 is the observation value of displacement;
- Column 9 is the observation value unit, which is meters for the displacement data;
- Column 10 is the observation error (
0is used for an unknown error); - Column 11 is the observation error unit, which is meters for the displacement data;
- Column 12 is the observation's quality control flag.
Tilde Data Exploration
These three plots show the east, north and up components of GNSS station position, evaluated once per day.
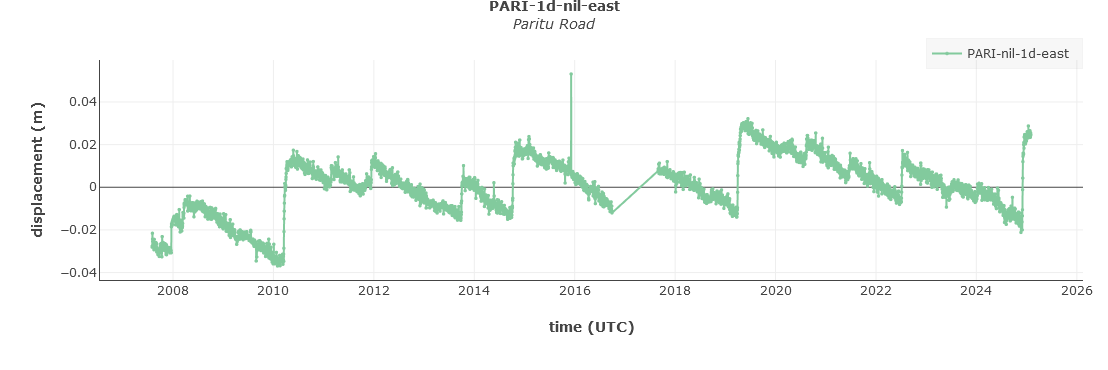
Figure 1 - PARI station - East component
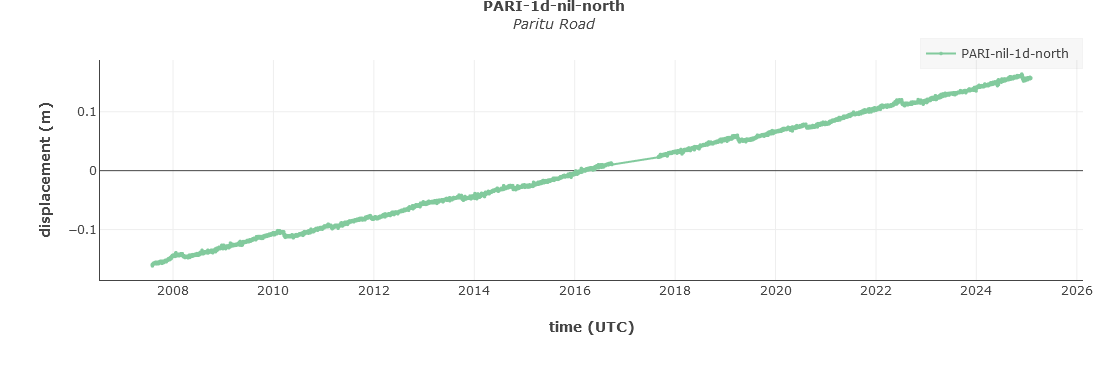
Figure 2 - PARI station - North component
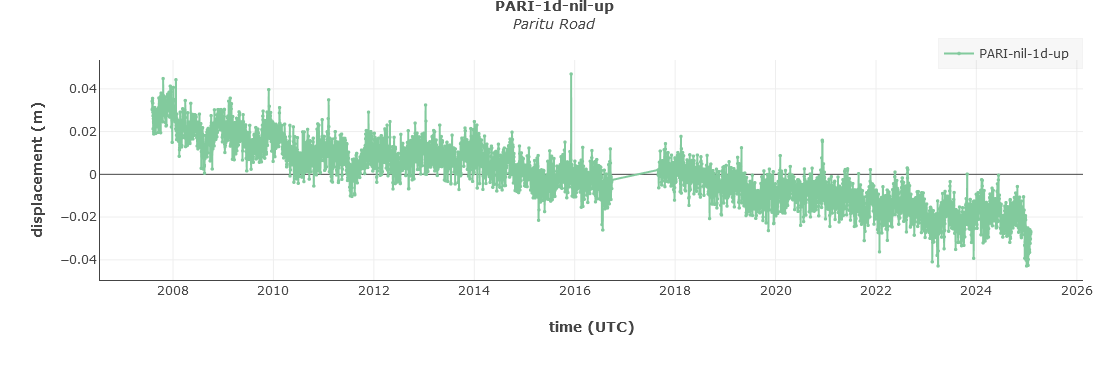
Figure 3 - PARI station - Up component
The use of these plots is to show the variation in station position with time. The plots are a derived product of the GNSS data provided by GeoNet, and are for indicative purposes only. Any scientific interpretation of the time series plots should only be done in consultation with someone with appropriate expertise.
In the absence of nearby earthquakes or slow-deformation events, these should be nearly straight lines. Variations about a straight line show the uncertainty (or noise) in the estimation of station position from a single day of GNSS data. Large outliers usually indicate some problem in the data processing; these problems are likely to be fixed if you view the plots again in a few days or weeks.
The values in the plots are in the ITRF2008 reference frame, but with a constant value subtracted from each time series so that its mean value is zero. The absolute values in the time series represent relative displacement of a site, and that the slopes of the lines do give velocities relative to ITRF2008.
The plots are updated with new information after each day’s daily processing of the GNSS data is complete, which is presently about 8am NZST time.
GNSS Processing
Before making any scientific interpretation of GNSS time series data, one should have a full understanding of at least the following items:
- how the data are collected;
- equipment or other changes at a site that may affect the data;
- the data processing;
- any filtering or other adjustment of the time series.
GeoNet provides site metadata, including equipment changes, in the Delta database and as IGS (International GNSS Service) format sitelogs and XML files on the GeoNet data site.
GeoNet makes every attempt to ensure that the information in Delta is correct and transcribed accurately to the RINEX headers, and that the same information is used during GNSS processing.
GNSS daily processing using GAMIT/GLOBK software
The GNSS processing is done using the GAMIT/GLOBK software developed and maintained by the Department of Earth Atmospheric and Planetary Sciences of the Massachusetts Institute of Technology (MIT). Without going into detail, some of our processing strategies are as follows:
- Solutions calculated each day for data 8 hours, 1, 3, 28 and 90 days behind UTC time;
- Orbits are held fixed and not solved for;
- IGS ultrarapid orbits for data 8 hours and 1 day behind;
- IGS rapid orbits for data 3 days behind;
- IGS final orbits for data 28 and 90 days behind;
- Earth Orientation parameters from IERS Bulletin A values (USNO and USND for most recent solutions);
- Ambiguity resolution by wide-lane and narrow-lane L1 and L2 (LC, ionosphere free) combination;
- Absolute IGS phase center corrections for satellite and receiver antennas from .atx-files provided by MIT;
- Ocean loading from FES2004 grid ocean tide model;
- Atmospheric delay estimated using the "global mapping function" (GMF) [Bohem et al (2006)];
- Atmospheric loading not applied;
- Depending on the increasing size of the network in time, a loosely-constrained solution is done as increasing numbers of clusters, each of less than about 30 stations and 6 tie sites, that are then combined during the reference frame realisation;
- Solution is aligned to ITRF2008, using a 6-parameter Helmert transformation (translation and rotation) onto available and good quality IGS sites in Australia, the south-west Pacific and the Antarctic.
The processing methodology is kept consistent throughout the time series. For further details please refer to the GAMIT/GLOBK documentation.