Silica Rapids - Looking at the Data
Welcome, haere mai to another GeoNet Data Blog. Today’s blog is a follow up on a recent GeoNet News story about collecting volcanic water samples from Silica Rapids on Mt Ruapehu.
A recent GeoNet News story about collecting water samples for volcanic analysis from Silica Rapids on Mt Ruapehu focused on why we do that work, how it’s done, and what the value of the data is to our volcano monitoring work. What that story didn’t talk about were the data themselves, and that is what we are going to look at today. Let’s pick up where the News story left off.
Silica Rapids
Silica Rapids is on the northwest flank of Ruapehu, west of the Bruce Road which runs from Whakapapa Village to the Whakapapa Skifield. As the News Story said, Mt Ruapehu has an active hydrothermal system inside the volcano, with the summit crater lake (Te Wai-ā-moe) the main surface feature. Silica Rapids, about 8 km “downhill” from Te Wai-ā-moe, is a “leak” from the hydrothermal system.
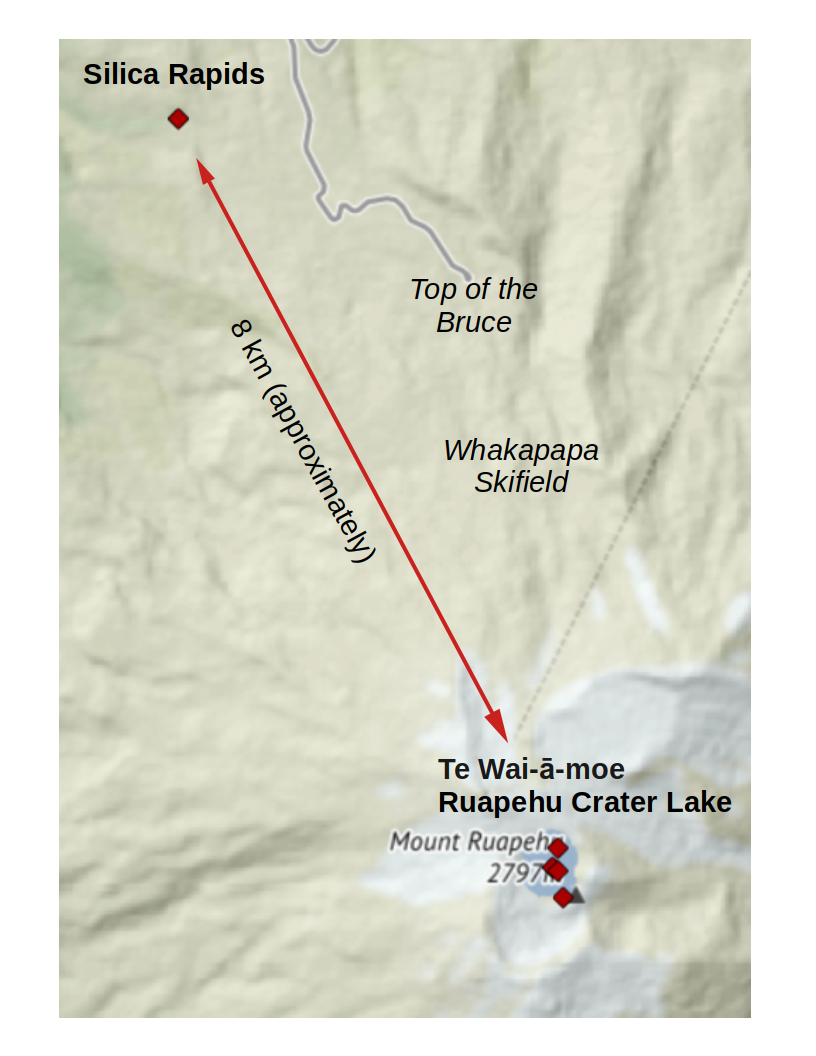
Silica Rapids is about 8 km “downhill” from Te Wai-ā-moe (Ruapehu Crater Lake), the main surface feature of Ruapehu’s hydrothermal system. The diamond symbols are the water sampling locations GeoNet has on Ruapehu.
Sample Analysis and Checking
The water samples are taken from Silica Rapids to the New Zealand Geothermal Analytical Laboratory (NZGAL) at GNS Science’s Wairakei Research Centre near Taupō. NZGAL does most of the analyses, but analyses of Hydrogen and Oxygen isotopes in the water are made by the Stable Isotope Laboratory at GNS Science’s National Isotope Centre at Gracefield near Lower Hutt. Karen Britten, who collected the water samples, checks the laboratory results to make sure everything is okay. Karen has the necessary knowledge, experience with results from water samples from Silica Rapids and elsewhere and can quickly recognise if anything is amiss.
Once Karen okays the analyses, she uses a web application to load the data into Tilde, our database application for low-rate data that has all the manually collected data from volcanoes, including data from water samples.
The Chemistry
If you didn’t enjoy chemistry at school, you can skip this section. Geeks may carry on reading.
The concentration of 19 different elements and compounds in the water are measured by NZGAL. We call these the “analytes” for short, and they are measured in units of “parts per million”, which is usually abbreviated as “ppm”. The analytes are (with chemical formulae): Aluminium (Al), Arsenic (As), Boron (B), Bromide (Br), Calcium (Ca), Chloride (Cl), Fluoride (F), Iron (Fe), Hydrogen Sulphide (H₂S), Bicarbonate (HCO3), Potassium (K), Lithium (Li), Magnesium (Mg), Ammonia (NH3),Nitrogen as Nitrate (NO3-N), Sodium (Na), Phosphorus as Phosphate(PO4-P), Sulphate (SO4), and Silica (SiO₂).
Let’s try to put parts per million (ppm) into something a little easier to grasp. A concentration of 100 ppm is equivalent to 1/50th of a teaspoon in one litre of water. That’s not much and gives an indication of just how good the measurement instruments are at NGZAL!
There are two isotope analyses measured by the Stable Isotope Laboratory. One is δ18O which is pronounced “delta-18-O” and is the ratio of the isotope 18O (Oxygen 18) to the more common isotope 16O (Oxygen 16) and then compared to an international standard. The other isotope measured is δ2H which is pronounced “delta-2-H” and is the ratio the isotope 2H (Hydrogen 2 – also called deuterium) to the more common isotope 1H (Hydrogen 1) and then compared to an international standard. The unit for isotopes is parts per thousand compared to the standard, commonly referred to as “per mil” and abbreviated as “0/00”. This comparison can give small numbers that are difficult to work with and units help with that a little, but even then, numbers can be negative and that makes understanding a little difficult.
There are a couple of other numbers that complete the data. The pH of the water sample, which measures how acid or alkali the water, is measured by NZGAL; pH has no unit. The temperature of the water at Silica Rapids is measured by Karen Britten when she collects the water sample. The unit of temperature is oC (degrees Celsius).
If you want to take a look at data from Silica Rapids you can use the Tilde Data Discovery GUI on our web site. The station code for Silica Rapids is “RU020”. You can find some more information in this blog. If you write computer code to access data then there are some Tilde tutorials showing how you can do that.
The Data
Silica Rapids is typically sampled once a year. The first data were collected in 2003, and the water samples from the recent News Story provided the 2024 data.
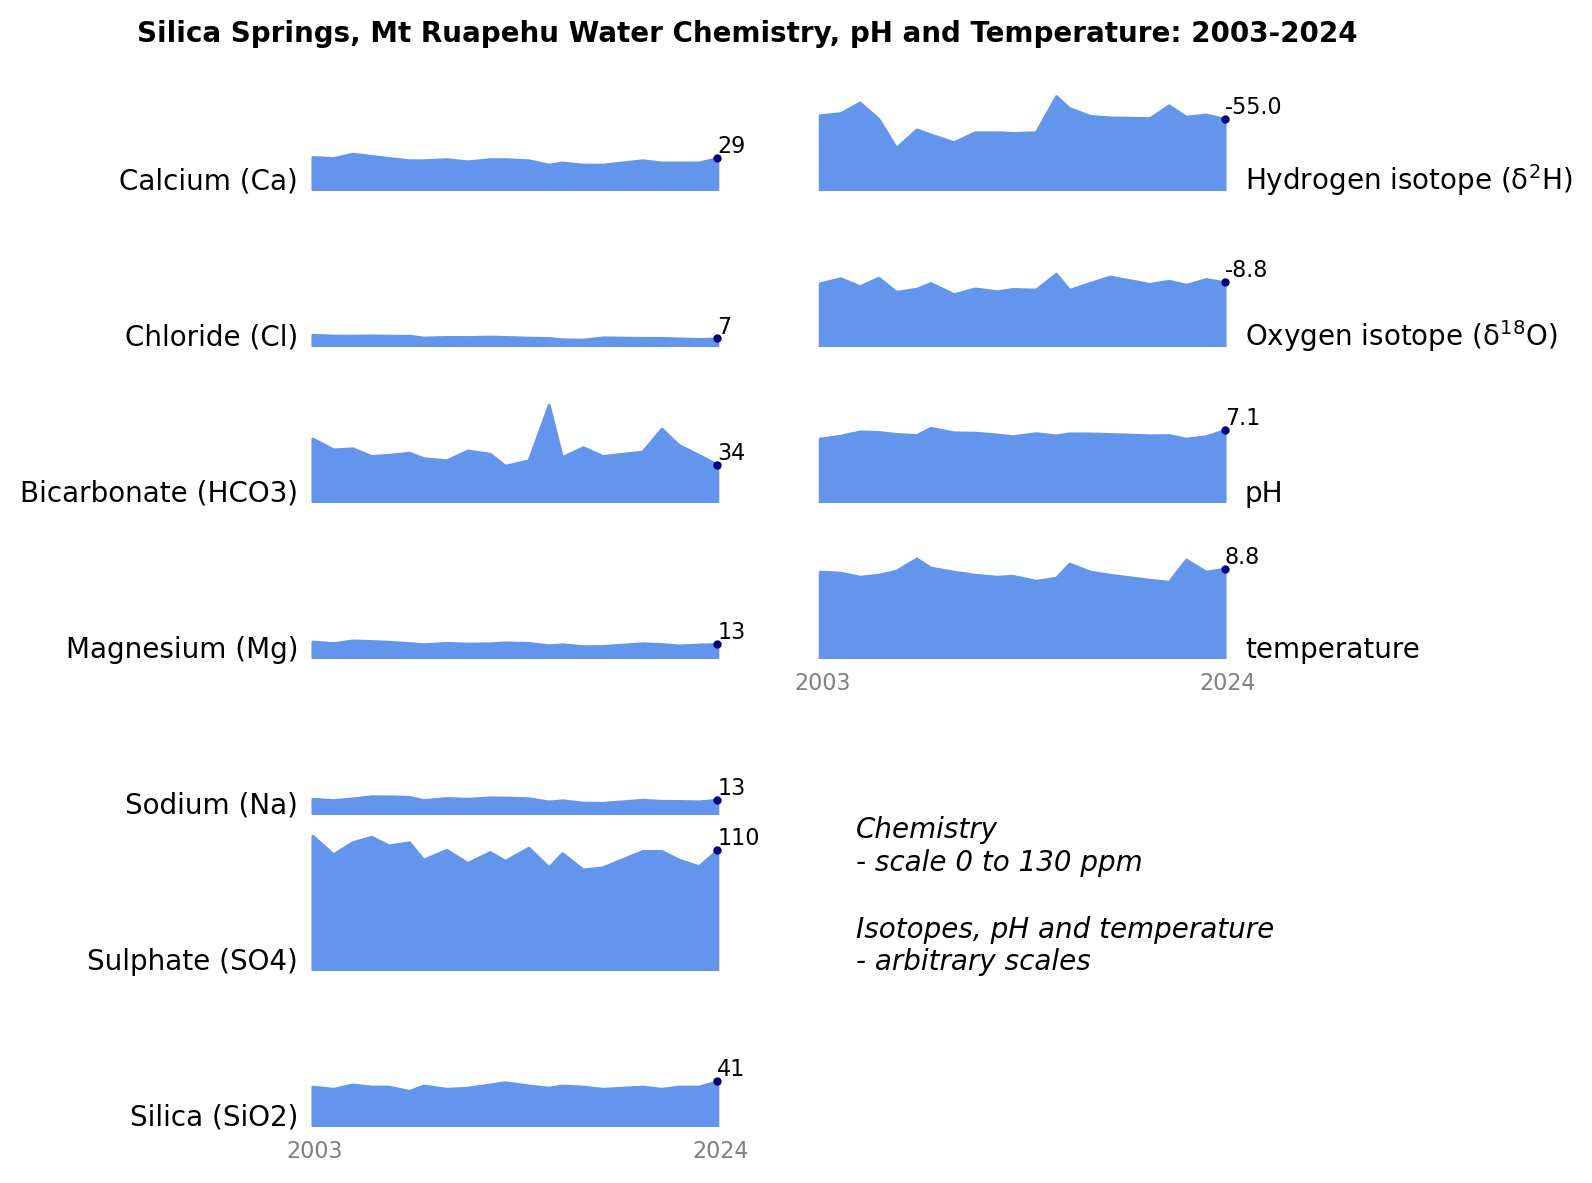
Data from analyses of water samples from Silica Rapids from 2003 to 2024.
In the graphic above the analyte concentrations (left side) are all on the scale 0 – 130 ppm. Only analytes with a concentration of 7 ppm or greater are shown. The isotope concentrations, pH and temperature (right side) are on an arbitrary scale that best shows variations over time. The values at the right of each graph are from the samples collected in 2024 and highlighted in the recent News Story.
More than half, 12 out of 19, analytes have a concentration of less than 5 ppm in Silica Springs water. The others range from about 7 ppm for Chloride to over 100 ppm for Sulphate.
As the isotope data are compared to something called Vienna Standard Mean Ocean Water, the values can be negative. Don’t worry about that, it’s the changes with time that matter.
The pH of Silica Rapids water is close to 7, which means the water is neither acid nor alkali. The temperature is about 8 oC. It’s cold because it spends most of its time underground.
Silica Rapids Chemistry Has Not Changed
The main thing you notice about the Silica Rapids data is that the water chemistry, isotopes, pH, and water temperature haven’t changed much since 2003.
The analyte concentrations from Te Wai-ā-moe are a lot higher than Silica Rapids, and together with pH, and temperature, vary with time a lot more. This is because water in Te Wai-ā-moe directly mixes with the hydrothermal system at Ruapehu. While changes in volcanic activity cause big changes in the hydrothermal system at Ruapehu, the water that leaks out to Silica Rapids is heavily diluted by rainwater soaking through the volcano so changes there are very small.
Although the chemistry at Silica Rapids hasn’t changed much, that “nil result” is still knowledge that helps the VMG understand what is happening beneath Ruapehu.
That’s it for now
While it’s great to learn how the samples are collected, getting a grasp of the data themselves is important too. Similar water samples are collected from over 30 volcanic localities (you can check them all out on Tilde!). The concentration of analytes varies a lot from feature to feature and there’s probably an interesting blog in there somewhere, sometime in the future.
You can find our earlier blog posts through the News section on our web page just select the Data Blog filter before hitting the Search button. We welcome your feedback on our data blogs and if there are any GeoNet data topics you’d like us to talk about please let us know!
Ngā mihi nui.
Contact: info@geonet.org.nz