Using Our Own Data – Hot Spring Water Level and Temperature
Welcome, haere mai to another GeoNet Data Blog. Today we have another in a short series of blogs looking at how GeoNet uses some of the data we collect. We are going to talk about water level and temperature data from Inferno Crater Lake, a large hot spring about 20 km south-east of Rotorua, what it is, how we use it, and how we present it for use in our day-to-day work.
Inferno Crater Lake is a hot acidic spring and one of many surface features fed by the Waimangu Geothermal System that visitors to Waimangu Thermal Valley, about 20 km south-east of Rotorua, in the central North Island can see. What makes this crater lake especially notable is that the water level and temperature vary up and down in a cyclic way over about 40 days. The water level variation is especially extreme, with changes of more than 10 m having been recorded. Water temperature varies from about 40 oC to about 80 oC. Such extreme cyclic variations are rare in hot springs anywhere in the world.
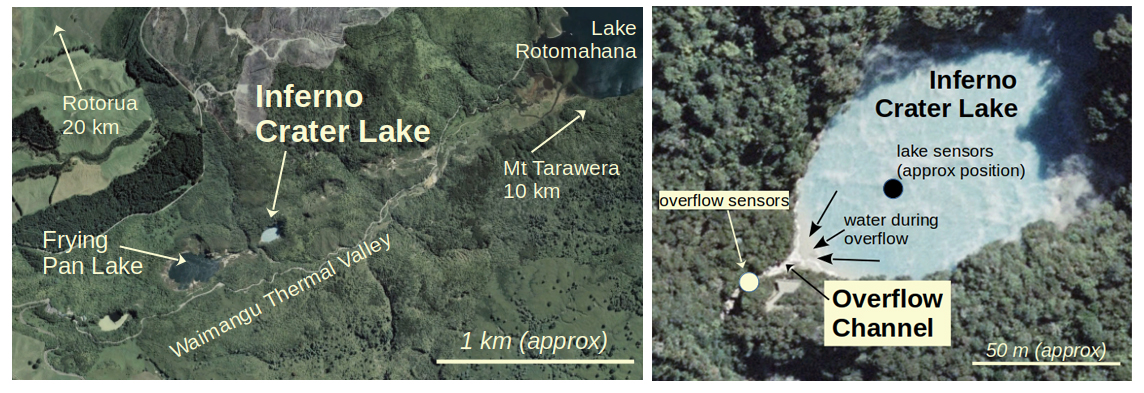
Inferno Crater Lake is in the Waimangu Thermal Valley, approximately 20 km south-east of Rotorua. The lake is 50-100 m across and contains hot, acidic water. The lake periodically overflows through a channel. GeoNet sensors in the lake and in the overflow channel monitor changes at the lake. Basemap is from Bay of Plenty Regional Council and Google Earth.
The crater that Inferno Crater Lake now occupies was formed during the 1886 Mt Tarawera Rift volcanic eruption, but the lake itself didn’t form until around 1900. Monitoring surface geothermal features can potentially give us a view into what is happening in the geothermal and groundwater systems related to active volcanoes. Waimangu lies adjacent to Mt Tarawera in the Okataina Volcanic Centre. We expect Mt Tarawera will erupt again in the future, but it currently has no earthquake activity and little geothermal activity so monitoring a feature like Inferno Crater Lake could be very important in identifying the early stages of a volcanic eruption. As the lake naturally has such large fluctuations, we need continuous monitoring and data visualisation to help discover any unusual changes in its behaviour. Historically, when and by how much Inferno Crater Lake has overflowed has been the key point of interest, so our data acquisition and display focuses on this.
The data
We monitor the temperature and water level of the crater lake, and temperature and water level in the overflow channel. We collect observations every 10 minutes.
The graph
Our graph consists of three parts:
The upper part shows the temperature of the water in Inferno Crater Lake plus the temperature of the overflow channel.
The middle part shows how far the lake height is below overflow.
The lower part shows the overflow rate from the lake, which we calculate from the height of water in the overflow channel.
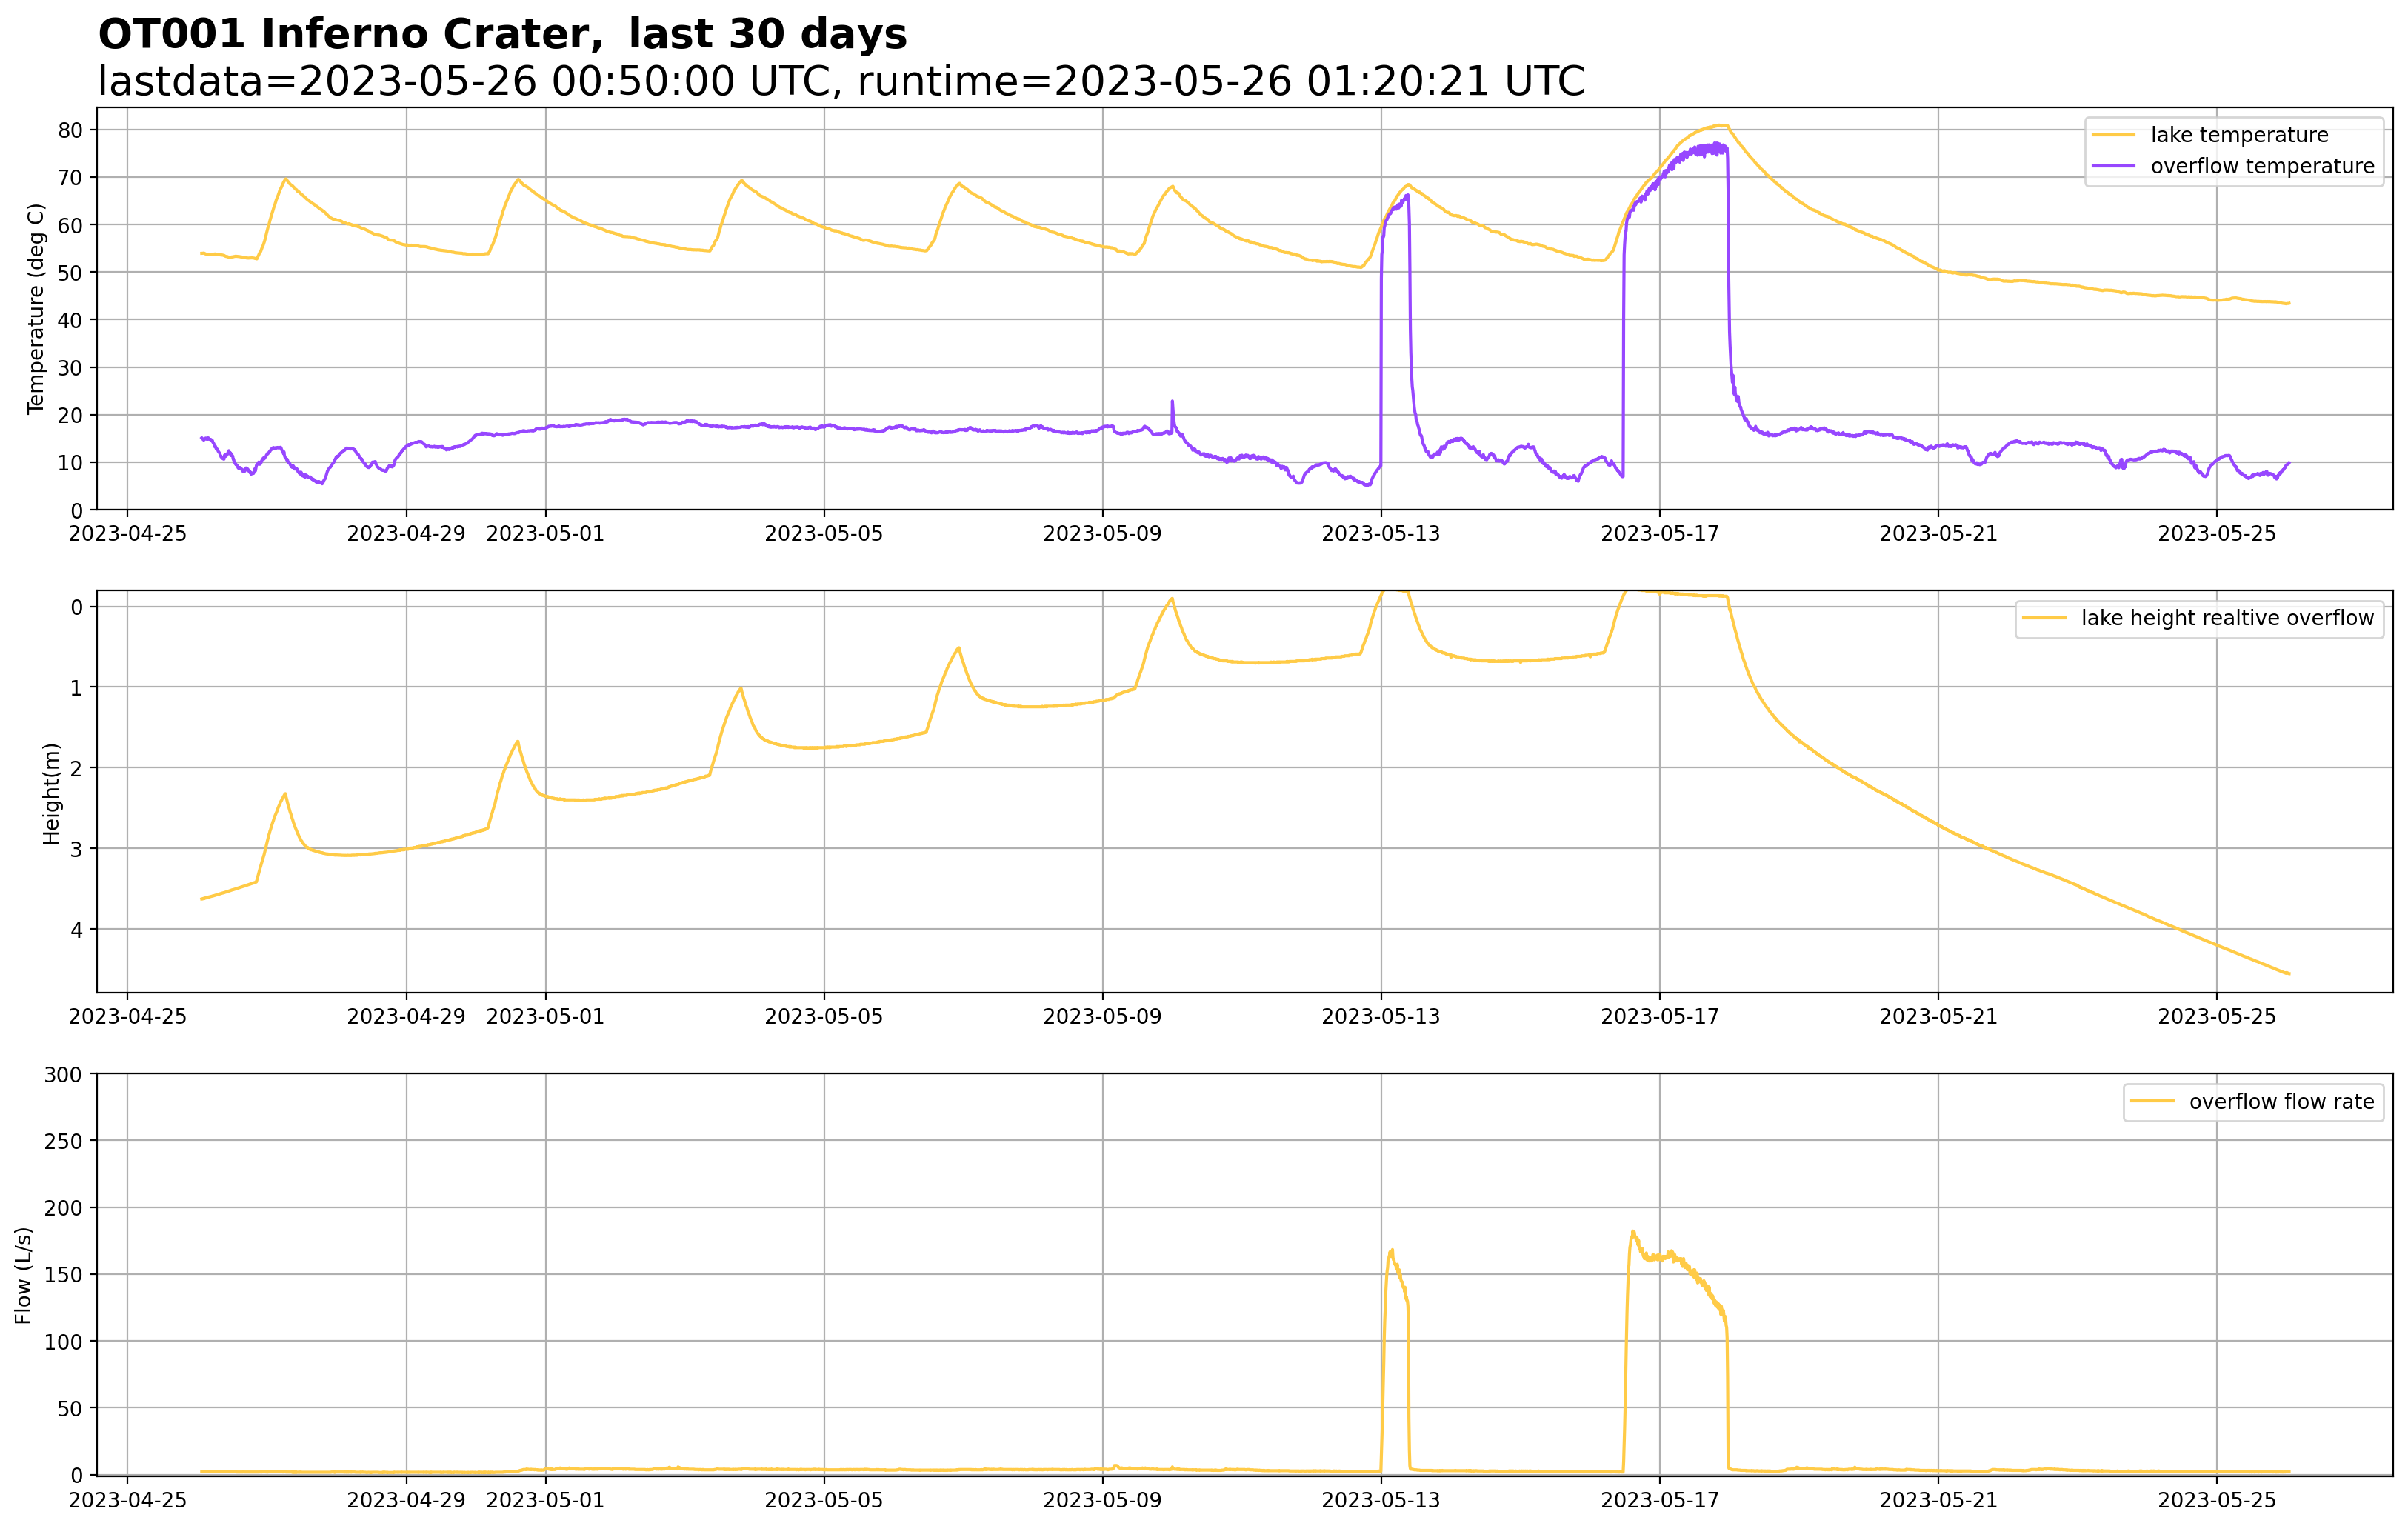
An example of our graph of the last 30 days of data collected from Inferno Crater Lake at Waimangu. The upper part shows temperature in the lake as well as temperature in the overflow channel. The middle part shows how far below overflow the water level in the lake is. The lower part shows the rate of flow of water out of the lake, which is calculated from the height of water in the overflow channel. You’ll notice that the flow rate is mostly zero (or thereabouts) as Inferno Crater Lake does not overflow all the time.
Here’s some more detail about the data that forms the graph.
Upper Part
We plot Inferno Crater Lake and overflow channel temperatures together. This is mostly as they are both temperatures, but plotting on the same scale allows us to see when there is an overflow and helps confirm we are getting sensible values from our sensors. Inferno Crater Lake temperature (in yellow) varies between about 40 oC and about 80 oC in this example and overflow temperature (in purple) varies between 10-80 oC. Prior to May 13 (labeled “2023-05-13”) we see a series of temperature oscillations between approximately 50 and 70 oC. The final of these, around May 13 indicates the lake reached overflow level and a short overflow occurred. We know this is an overflow because the temperature in the overflow channel, labeled “overflow temperature” rises from about 10 oC to almost the same as the lake temperature. When the lake is not overflowing, the overflow temperature sensor measures the air temperature, but once there is an overflow, water touches the sensor, and it measures the temperature of the hot water. After a further 3-4 days, starting just before May 17 (labeled “2023-05-17”) the lake water again rises to overflow level. The temperature reaches 80 oC in the lake, and about 75 oC in the overflow channel. This marks the main overflow period for this “cycle” and continues for about two days. Once the overflow has ended, the temperature in the lake drops to about 40 oC over the next week, and the overflow channel temperature returns to showing air temperature, as there is no longer any hot water in the channel.
Middle Part
This part of the graph shows how far the lake height is below overflow, labeled “lake height relative overflow”. The sensor that measures this is within the lake, located next to the temperature sensor. The lake height sensor uses water pressure to estimate the amount of water above the sensor. The value we get depends on how deep in the lake the pressure sensor is, and we correct the data relative to the overflow level. As the lake water level approaches the overflow height, the corrected height approaches zero.
Lower Part
The lower part of the graph shows the rate of flow from the lake through the overflow channel, labeled “overflow flow rate”. The units of flow are litres per second (L/s). In this example, non-zero data are recorded during the two overflow episodes with a maximum overflow rate about 150 L/s. That’s not very easy to picture in your mind. Try to think of 150 one litre cartons of milk flowing past each second. Still not that easy to picture! Staying with a shopping themed analogy, 150 litres is about the volume of a typical large supermarket trolley, so imagine one of those full of 80 oC water going past each second! What we actually measure to derive these flow rates is the height of water in the overflow channel using a downward facing radar beam. The radar beam bounces off the surface of the overflowing water or the bottom of an empty channel when the lake isn’t overflowing. We convert this water height to a flow rate by means of a formula which we’ll talk about in the next section.
We calculate and show flow rate rather than height because its more useful if we want to model the geothermal system to estimate the amount of heat coming into the lake. This involves comparing outflows of water and heat to estimate heat input to the system. We don’t actually do that modeling at the moment at Inferno Crater Lake, but we do it for Te Wai ā-moe Ruapehu Crater Lake.
Finally, we label the graphs so it’s clear what we are looking at. The two lines above the upper part of the graph are the title.
OT001 is the code use for Inferno Crater Lake monitoring system. Inferno Crater is the site name. The time period covered by the graph is the last 30 days.
The second line shows the time of the last data values on the graph, labeled “lastdata”, and the time the graph was made, labeled “runtime”. “UTC” means “Universal Time”, which is 12 hours behind New Zealand Standard Time, and the time zone GeoNet uses to collect all of its data. We show both lastdata and runtime so that we can quickly check if data haven’t been retrieved from the site for a long time. The graph is created every four hours.
Calculating flow rate (optional reading)
So far, we’ve simply referred to the overflow channel and the flow rate, but it’s actually more complicated than that. Agencies that measure river flows typically report the data as a height relative to some reference point on the riverbank. For example, Horizons Regional Council’s water level gauge at the Town Bridge in Whanganui shows water level in millimetres (mm). The height typically varies between about 5,000 and 7,000 mm, 5 to 7 metres. The cyclic variation you’ll see in these data is because the Whanganui River is affected by tides at this location. Environment Canterbury provides river flow rate data as well as river height. For example, at Middle Creek at the SH1 Bridge near the northern outskirts of Kaikoura. Environment Canterbury does this by using a relationship called a “rating curve”, which allows flow rate to be calculated from water height. The process of calculating a rating curve can be quite time consuming and must be revised if there is substantial erosion or deposition changes in river channels.
In the case of Inferno Crater Lake, we are quite fortunate as the water in the overflow channel flows through what is called a “Parshall flume”, named after hydrologist Ralph Parshall. This means that the channel has a particular size and shape and so the rating curve formula is already known. If you measure water height at a particular position in the flume you can use a relatively simple formula to work out flow rate. For the flume in this overflow channel the formula is: flow = (1.056 x height1.538) x 1000
Height in metres is taken to the power of 1.538 and then multiplied by 1.056. This gives a value in cubic metres per second (cumecs). We multiply this by 1000, to get a value in litres per second (L/s).
For interest, the typical flow rate at Middle Creek near Kaikoura – the example we used earlier – can exceed one cumec, or 1000 L/s, several times larger than typical overflow rates at Inferno Crater Lake.
The water level and temperature data set
The water level and temperature data we have been writing about are two of the new environmental data sets we have recently begun collecting. In the case of Inferno Crater Lake, data have been collected for many years, but only recently in a way that permits us to make them available to everyone automatically. The data are recorded every 10 minutes and sent to our data centre each hour. The easiest way to access these is through our Tilde Data Discovery GUI where you can explore and download any data you might want to investigate. Please note that although internally we calculate and use the flow rate data in the overflow channel, we currently only make available water height. Likewise for water level in Inferno Crater Lake, while we internally show how far below overflow, we currently make available how much water there is above the sensor.
That’s it for now
That ends our brief look at hot spring temperature and water level data at this unique crater lake. We’ve only dug a little way into these data and there’s a lot more we could talk about, perhaps another time! You can find our earlier blog posts through the News section on our web page, just select the Data Blog filter before hitting the Search button.
We welcome your feedback on this data blog and if there are any GeoNet data topics you’d like us to talk about please let us know!
Ngā mihi nui.
Contact: info@geonet.org.nz