Take a peek at our remote volcano monitoring toolkit
Rapidly advancing science gives our volcano team a wide range of remote monitoring tools to keep a close eye on our active volcanoes. The data from these tools helps us provide valuable information to responding agencies, infrastructure providers and the public, to support disaster management and building community resilience.
Activity at an active volcano is driven by magma at depth. Unrest or continued eruptive activity can change as this magma rises to shallower levels. This change in the magmatic and associated geothermal systems can create seismic, chemical, thermal, visual signals, as well as ground deformation. It is changes in these signals that we are monitoring as they give us insight into what may be happening within the volcano.
Cameras
We have 10 active remotely operated cameras near our volcanoes. They are setup to take an image very second, and then transmit an image every 10 minutes to our data centres and website. If we need to see images during unrest or an eruption, we can download the 1-second images stored on the cameras. Our cameras have two lenses, one for normal day light and a specialised lens for at night that can show hot regions in an image.
View: Our volcano cameras
Read: GeoNet Data Blog on our new Whakaari/White Island camera
Gas and observation flights
We charter local fixed wing aircraft and helicopters to make gas measurements, collect thermal data, photography, and visual observations of New Zealand’s active volcanoes.
On our gas flights we mainly use two techniques to measure the amount of gas coming from the volcano – plume contouring and upward looking spectrometers.
Plume contouring requires the aircraft to fly through the volcanic gas plume at different altitudes. A pump inside the aircraft sucks in the gases through an analyser (LICOR and Interscan instruments) measuring the concentration of carbon dioxide (CO₂), sulphur dioxide (SO₂), and hydrogen sulphide (H₂S). SO₂, in particular, is a key volcanic gas as it is derived directly from magma – so you will see we have a few techniques for measuring and assessing SO₂ output.
The upward looking spectrometer (FLYSPEC or mini-DOAS) is mounted in a modified door and measures the intensity of ultraviolet light as we fly under the gas plume. This gives us a sense of the SO₂ content of the volcanic gases in the plume because SO₂ absorbs UV light.

Our specially modified door to mount the sensors we use, in this case on a float plane (left). View of technician gathering gas readings from inside a plane (right).
Thermal InfraRed
Handheld thermal InfraRed (TIR) cameras give us data about the temperatures of steam and gas vents (fumaroles) and active volcanic vent(s). At Whakaari/White Island we can get this data from a helicopter, as shown in the video below.
Temperatures of the steam and gas vents will range from 80-90 °C to over 2-300 ºC. While the active eruptive vents can range up towards 900 °C.

Raw TIR image, false colour TIR, standard image 21 August 2024. A maximum of 492 ºC is indicated by the red triangle in the raw image.
Before each observation flight we undertake robust safety planning and risk assessment. Our proximity to a volcanic plume is assessed and we adhere to the applicable aviation rules to maintain a safe distance, all passengers on-board are belted in and secure.
ScanDOAS
Last year we installed a network of continuous gas emission detectors, called ScanDOAS, around Ruapehu volcano. These instruments allow us to monitor the amount of SO₂ (sulphur dioxide) gas the volcano produces. They collect data every 5 minutes during daylight when the sky is sufficiently bright.
Read: More on the ScanDOAS network
Satellites
We routinely get ground deformation and gas data from satellites. They can also provide thermal data if a volcano is ‘hot.’
InSAR (Interferometric Synthetic Aperture Radar) is a technique for mapping ground deformation using space-borne radar images of the Earth's surface.
Any movement of the ground surface toward or away from the satellite can be detected and indicates how much the surface moved (deformed) during the time between images (8-20 days). Under good conditions, the technique can measure displacements with a precision of a few millimetres.
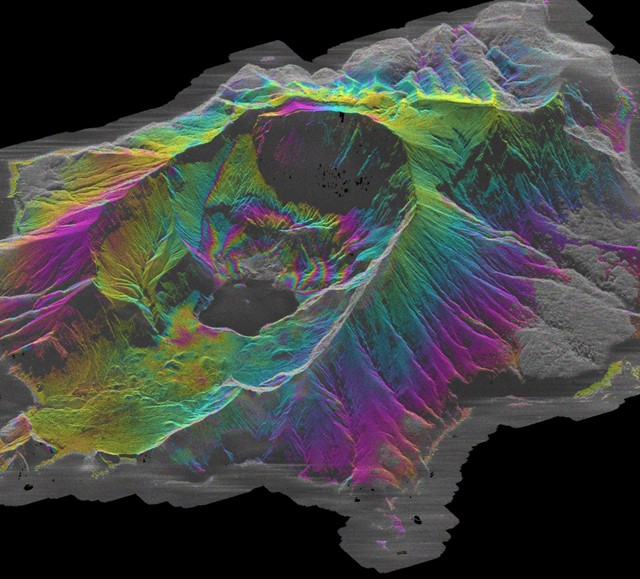
Hi-resolution interferogram showing deformation around the active vent area from September 2022. Each of the coloured contours represents 15 mm of subsidence near the active vent.
TropOMI (TROPOspheric Monitoring Instrument) is a European satellite used for tropospheric (the lowest layer of Earth's atmosphere) data capture. When the SO₂ output from a volcano is high we can get data from this satellite, SO₂ is a key volcanic gas as it is derived directly from magma.
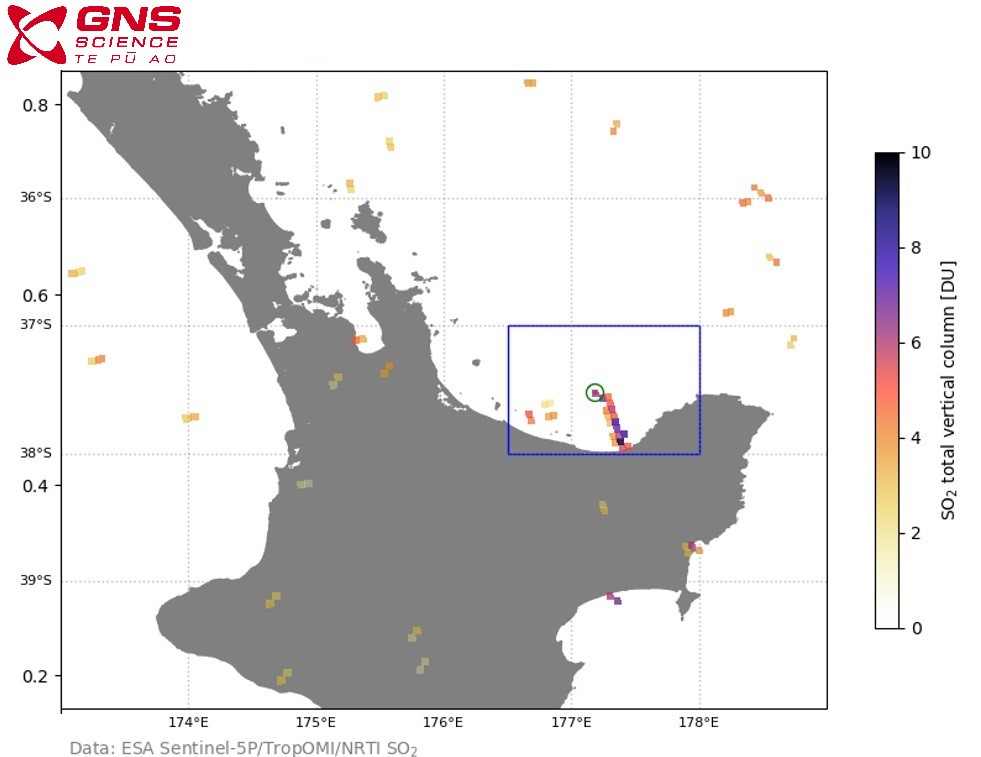
TropOMI example from Whakaari/White Island on 22 August 2024, showing the SO2 plume to the east of the island.
Another satellite we have access to is the Sentinal-2. This satellite is often used to track large wildfires, we use it to see heat signals on our volcanoes. Below we have an image from this satellite taken on 12 August of Whakaari/White Island. The sensors on the satellite collect data from various wavelengths (bands). This gives coverage across visible colours to shortwave infrared.
The image shows band12, band11 and band5 in RGB (red, green, blue) combination. The shortwave infrared B12 records anomalous heat signatures which appear as bright red colour in this combination.
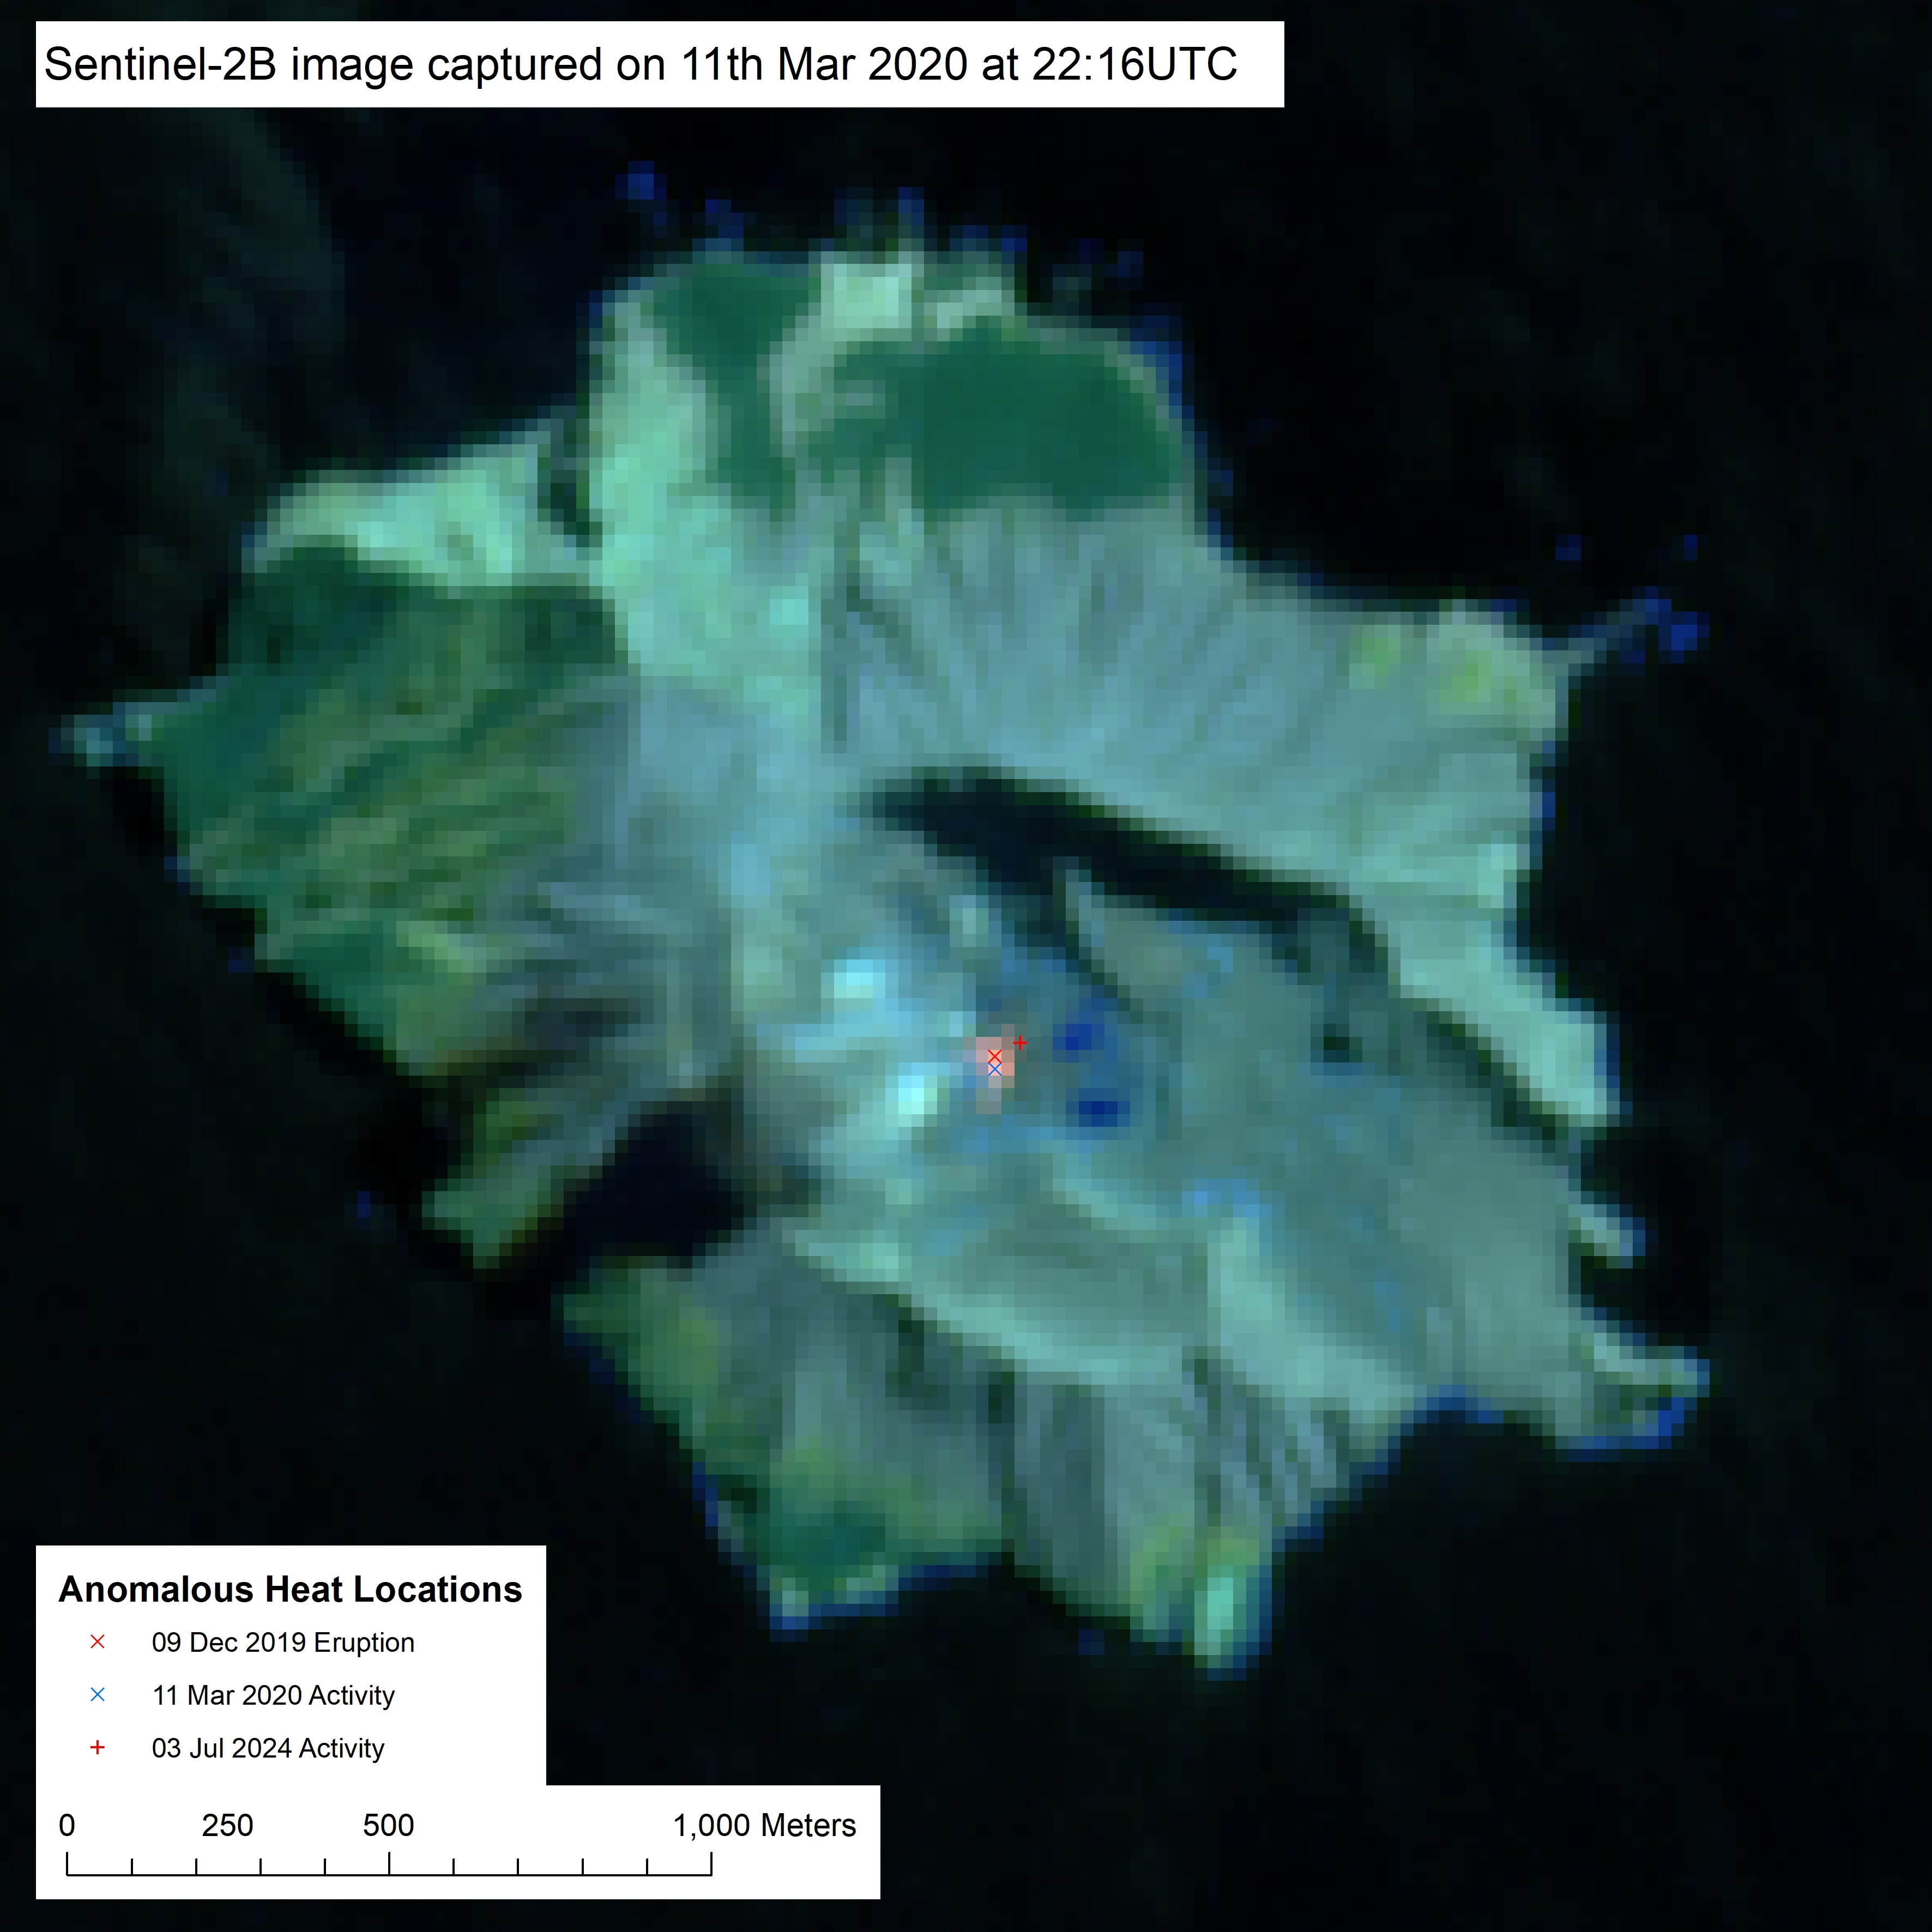
Sentinal-2 false colour image showing Whakaari/White Island. The bright colour spot is the active vent area.
Being Prepared
The National Emergency Management Agency's (NEMA) Get Ready website has information on what to do before, during and after volcanic activity.
During volcanic activity, follow official advice provided by your local Civil Defence Emergency Management Group, the Department of Conservation (for visitors to the Tongariro and Taranaki National Parks), local authorities and emergency services.
Prepare your home. Protect your whānau.
There’s a lot we can do to make our homes safer and stronger for hazards. The National Hazards Commission Toka Tū Ake's website has key steps to get you started.
Toi Te Ora Public Health: Volcanic Activity
Volcanoes produce many hazards that can impact health. Under certain conditions volcanic ash and gas can travel from an erupting volcano in the air and may cause health problems for people living some distance away. This usually only happens when there is a large eruption, and the wind direction blows the ash and gas towards places where people live. Read more on volcanic health hazards here.
Media contact: 021 574 541 or media@gns.cri.nz