Units and values, another way of looking at the diversity of our data
Welcome, haere mai to the first GeoNet Data Blog of 2025! Today’s blog talks about the diversity of our data from the point of view of the units used to represent the data values.
We’ve talked about the wide range of data we collect at GeoNet before, through the lens of how data collection has grown over time and how often we collect data. Today we want to look at it from the perspective of the units that are attached to the data values we collect. To make that clear, when we drive our car, the unit of speed is kilometres per hour (km/h) and when we eat a hamburger, the unit that describes how much energy it contains is kilojoules (kJ).
Why do we think that units and values of the things we measure will make an interesting data blog? Simply because it highlights the range of types of our data, illustrates how the data units used are decided by international standards and the needs of our data users, and finally, because there are some interesting oddities to talk about.
Units and metadata
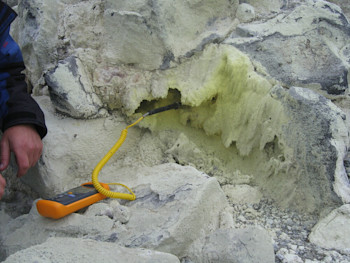
Units are a fundamental part of metadata: the information that describes and helps people correctly use data. Let’s take a simple example: GeoNet reports that the temperature of a fumarole (a steam and gas vent) on Mt Tongariro is 400 degrees. If you live in Aotearoa New Zealand, you’ll (correctly) assume that is 400 ⁰C (Celsius). But, if you live in the US, you might think it means 400 ⁰F (Fahrenheit), as that is the unit of temperature widely used in the US. In absolute terms, 400 ⁰F is only a little more than 200 ⁰C. You can see the problem: as both 400 ⁰C and 200 ⁰C (400 ⁰F) are realistic values for the temperature of steam and gas emitted from a fumarole, the number alone isn’t enough. We also need the unit.
Understanding what the unit is, is especially important with really large or really small values when we don’t have anything familiar, we can compare it with. GeoNet collects some data with quite large and small values.
SI units
There is something called the International System of Units, abbreviated as SI, from the French (Système international d'unités).
The basic SI units cover time (second), length (metre), mass (kilogram), electric current (ampere), thermodynamic temperature (kelvin), amount of substance (mole), and luminous intensity (candella).
At least the first few should be familiar to most readers. For temperature, we typically use Celsius rather than kelvin (unless you live in the US!) and both are recognised SI units. GeoNet uses mole for chemical analyses, but luminous intensity, which is related to the brightness of light, is not something we have any need for.
In addition to these seven basic units, there are a number of derived units which are also SI units. We’ve already talked about the speed of a car being measured in km/h, but the SI unit is in fact metres per second (m/s), derived from the unit of distance (metres) and the unit of time (second). In case you are wondering, 100 km/h is 27.8 m/s. You can probably see why km/h is more practical than m/s for road speed limits!
When it comes to data, GeoNet tries to stick to recognised SI units. Overall, this makes it easier for everyone to understand, and if ever a value needs its units converted, the conversion factors are readily available.
Examples of SI and derived units in GeoNet data
A lot of our data are provided in SI units, for the reasons we mentioned.
Wind speed; measured in units of metres per second (m/s). This isn’t data we collect a lot of, but we do need it for some of our volcanic gas monitoring.
Water height; measured in units of metres (m). A good example of this is the height of water above a DART station monitoring for tsunami in the deep ocean, or the tsunami gauges along our coastline.
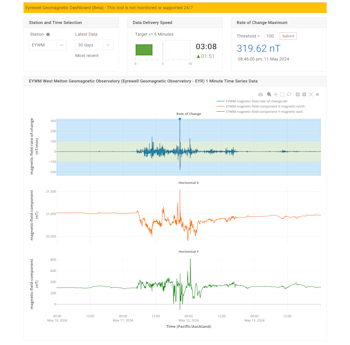
Magnetic field; measured in units of nanoTesla (nT). This is one many of you won’t be familiar with. The unit tesla measures the amount of magnetic flux density (think water in your garden hose) and is derived from the units for mass, speed, and electric current. The “n”, which stands for “nano” means one billionth or a factor of 0.000000001. The total magnetic field measured in Aotearoa New Zealand is around 50,000 nT. What typically matters to our electricity providers is the rate of change of the field, which they think of in units of nanoTesla per minute (nT/min). So, the basic unit is SI, but we’ve worked with our data users to provide a product in units that best fits their needs.
Ground shaking; measured in units of metres per second (m/s - speed). When we think about ground shaking in an earthquake, we don’t often think about how it is measured. Our sensors measure the speed of ground shaking digitally in counts, and each sensor has a scaling factor between how many counts it records and what that represents in units of m/s.
These values are usually really small – much less than one, so they can be hard to relate to and difficult to work with. Practically, we often scale them into nanometres per second (nm/s) as this makes the numbers a lot bigger and more convenient to use. This is the same “nano” used with magnetic fields and means one billionth. Take a look at our RSAM blog for an example of this applied to monitoring volcanic ground shaking.
Strong ground shaking; measured in units of percent ground acceleration or PGA. We previously said ground shaking has units of metres per second, but not when it’s strong ground shaking! The earthquake engineering community has their own set of data which best fit their data applications and are easier to relate to when the ground shakes a lot in a really big earthquake, and we try to provide data for them the way they like to use it. They like to use peak values such as PGA, but PGV (peak ground velocity) is also sometimes used.
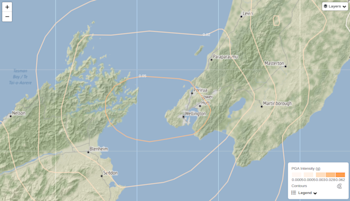
To understand acceleration, think of the car analogy again, acceleration is how quickly the speed increases or decreases. Earthquake engineers like to compare the observed acceleration with gravity, gravity is an acceleration equal to 9.8 m/s² (metres per second per second). So, if a strong earthquake produces a shaking with an acceleration of 4.9 m/s², earthquake engineers refer to it as 0.5 g (or 50% g), meaning equivalent to half the acceleration due to gravity This is a great example of where we provide data to suit the needs of an established group of data users. You can see examples using our Shaking Layers application on our website.
Some unusual cases
While there are cases where we provide data in base SI units, we sometimes use multiples or fractions of those units, typically because it’s an international standard or because base SI units gives values that are very small or very large and so inconvenient to work with. The “nT” and “nm/s” examples we mentioned earlier are good examples, but there are others.
GNSS displacement; measured in units of millimetres (mm). We calculate and provide daily changes in the position of all our GNSS sites as a displacement (position change) from a reference point. Logic would dictate we use metres for the unit, but as the displacements are often less than a millimetre a day, we have been using millimetres instead. This means we don’t have to work with relatively small fractions of a metre. But, for consistency with related observations, we are thinking about whether we should use metres instead. This is an example of their being valid arguments for two different units, and our experts have to make the call. If we do make a change, it will be in the next few months when we move GNSS displacement data from FITS to Tilde, and we’ll make sure all our users are well informed.
Concentration; measured in units of milligrams per litre (mg/L) or parts per million (ppm). This is used for chemical analysis by our volcanologists. Check out our recent blog on NZGAL. Milligrams per litre is a weight of something in a volume of liquid (think a teaspoon of sugar in a cup of coffee). The alternative unit sometimes used, ppm, describes a fraction of a whole. As one litre of water weighs one million milligrams, the value is the same if we use mg/L or ppm as a unit. And sometimes we might do that interchangeably, apologies as that is confusing.
We also use ppm for the concentration of gas, specifically that we collect using our MultiGas sensors. For example, the typical concentration of carbon dioxide (CO2) in the atmosphere in Aotearoa-New Zealand is about 420 ppm. Our sensor near a fumarole on the summit of Ngauruhoe commonly measures values of about 700 ppm. This CO2 gas comes out of the fumarole and is of volcanic origin.
Our volcanologists have a couple of further unit oddities.
Gas emission rate/flux; measured in units of tonnes per day (t/d). The SI unit is kilograms per second (kg/s) and you’ll find we provide our data with those units, for carbon dioxide (CO₂), hydrogen sulphide (H₂S), and sulphur dioxide (SO₂) collected by our airborne platform, commonly called “gas flights”, and for SO₂ with our scanDOAS instruments. However, t/d is common among the international volcano community. A tonne is 1000 kilograms (kg) so is a scaled SI unit. A day is 86400 seconds, which really messes up the scaling as it’s not scaling the SI unit of time by a multiple of 10. Measured in units of t/d, gas emission rates might be anything from 100 to as much as 5,000, but in units is kg/s that corresponds to just over 1 to about 50. If you talk to one of our volcanologists, you’ll probably hear them talking tonnes per day rather than kilograms per second!
Gas emission rate though the ground; measured in units of grams per square metre per day (g/m²/d). Another oddity of volcanic emission rates appears when we measure gases coming directly out of the ground. We normally only do this for CO₂ and H₂S, but it’s not currently a monitoring system we are using. The g/m² part is logical and another SI unit scaled by a factor of 10. But then it’s expressed as a daily value just to complicate things! But it’s another example of how we work with our data users.
That’s it for now
That’s our quick chat about the units we use for our data, and some of the more interesting ones. Without units it’s really difficult to understand data, and without that, well there’s not much value in collecting the data in the first place. Sometimes we work fully with a user group and provide data and data applications in the units they prefer, in other cases, we are providing data in SI units, but we know our users can easily convert the data to a different unit because conversion factors are readily available.
Next time you see us talking about some data, or perhaps read something in the media referencing data, take a moment and ask yourself if you understand the units used and think if you might misunderstand what is being said if the units were absent or unclear. That is how important units are! You can find our earlier blog posts through the News section on our web page just select the Data Blog filter before hitting the Search button. We welcome your feedback on our data blogs and if there are any GeoNet data topics you’d like us to talk about please let us know!
Ngā mihi nui.
Contact: info@geonet.org.nz


