
Describing The Depth of Earthquakes Beneath Lake Taupō
Welcome, haere mai to another GeoNet Data Blog. Today we explain how we chose to describe the depth of earthquakes beneath Lake Taupō in our recent Volcanic Activity Bulletins.
If you’ve been following the news in recent weeks, you’ll probably be aware that GNS Science’s Volcano Monitoring Group (VMG) set the Volcanic Alert Level for Taupō volcano at 1, indicating minor volcanic unrest. If you read the Volcanic Activity Bulletin where we announced the alert level change you might have noticed that when referring to the earthquakes we said* “mainly at a depth of 4 to 13 km beneath the lake”*. How did we come up with that statement? It’s not as straightforward as it might seem, and that is what we are going to look at today.
Depths of shallow earthquakes and a “rule of thumb”
An earthquake’s depth is an important component of its location, and for earthquakes at a volcano, depth is often key to trying to understand what processes are going on below the surface. But we need to ensure that if depth is very uncertain that we don’t over interpret it. In other words, it is important that we don’t try to evaluate differences in the depths of earthquakes when those differences are dwarfed by the overall depth uncertainty. The way we do this is by applying a “rule of thumb” that states that if the closest seismograph to an earthquake is at a horizontal distance greater than twice the earthquake’s calculated depth, then that depth is probably too uncertain to be used. That explanation is quite a mouthful, so here it is as a picture which hopefully conveys that more clearly.
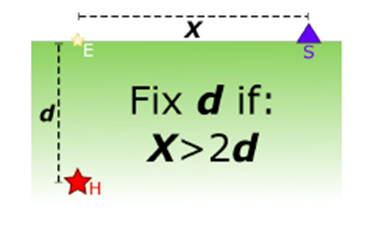
Rule of thumb that decides when our NGMC sets the depth of an earthquake to a realistic value, rather than the estimated value. The star represents the earthquake location underground, E is the projection of that location at the surface of the Earth (i.e., where the earthquake plots on the map), d is the calculated depth of that earthquake under the surface, and X is the horizontal distance from that earthquake to the closest seismograph (S).
When this situation occurs, our National Geohazards Monitoring Centre (NGMC)’s procedure is to set the depth to a realistic value, for the Lake Taupō region the depth is set to 5 km. If you examine the recent earthquake catalogue for Lake Taupō you’ll find a lot of earthquakes where the depthtype parameter is listed as operator assigned and the depth is 5 km.
The problem of very uncertain earthquake depths is more prevalent at Lake Taupō than most other parts of the country. Elsewhere, if there are persistent shallow earthquakes that have a very uncertain depth, we’ll consider adding a seismograph close to the earthquakes, which should substantially reduce that uncertainty. That’s not easy to do at Lake Taupō as we can’t easily install seismographs under the lake surface.
A previous data blog talked about the Aotearoa-New Zealand earthquake catalogue in some detail. Take a look if you are interested.
Describing the earthquake depths
When the Volcano Monitoring Group (VMG) wanted to describe the depth of earthquakes beneath Lake Taupō, the first thing required was to exclude all earthquakes where the depth hadn’t been estimated from data but had been set by the NGMC because it failed the rule of thumb. You do this by simply removing any earthquake where the depthtype parameter was operator assigned. From almost 700 earthquakes, this reduced the total to just over 200. In other words, in 2022, we have been able to estimate the depth for only about one-third of earthquakes beneath Lake Taupō. When thinking about earthquake depths we also have to consider how well our velocity model matches the speed of earthquake waves in the Lake Taupō region as that impacts our depth estimates. You can read more about that in a previous blog.
The next question to ask is exactly how do we describe the depths of the 200-odd earthquakes left in our list? We can’t list every earthquake depth, so we need a number or numbers that provides a meaningful summary for the public and our key stakeholders. Do we use some kind of average, if so, which measure of average? What about giving a range, and if we do that, should we use the shallowest and deepest earthquake depth or some other range? We are going to look at this now.
What does the depth distribution look like?

Histograms of the earthquake depths (in 1 km bins) at Lake Taupō in 2022. Depths that were operator assigned haven’t been included.
Our depth distribution has a “long tail”. By this we mean that there are quite a few values greater (in our case deeper) than where the bulk of the depths are found.
Average and range
The purpose of the average of some data value is to try to, with a single number, to convey a representative value for the data distribution. Most of us use the word average frequently in our everyday lives and are probably thinking of the mean of the data when we do that. The mean is calculated by summing all the data values and dividing the number of values. The median is another measure of average that is the middle value when all the values are placed in order, smallest to largest. We are probably most familiar with the median with its use in describing property prices.
For our earthquake depth data set the mean depth is 7.414 and the median is 6.879. We’d typically round these numbers to one decimal place considering the uncertainties in our earthquake depth estimates, giving 7.4 km and 6.9 km, respectively. In this case mean and median aren’t that different, but if there are outliers or the distribution of values is very asymmetric, as applies in our case, then it is often better to use the median.
As we can see, both the mean and median give a reasonable representation of the centre of our distribution of depths, but don’t give any information about the spread, how shallow the shallower earthquakes are, and how deep the deeper ones. Statisticians tend to use the standard deviation of a distribution to measure this spread. For a general audience, and let’s face it most of us aren’t statisticians, the VMG felt standard deviation wasn’t easily understood, so we chose to use percentiles. An illustration will show you what is meant by percentiles.
Percentile  Meaning
10          10% of values lower and 90% higher
25          lower quartile, 25% of values lower and 75% higher
50          median, 50% of values lower and 50% higher
75          upper quartile, 75% of values lower and 25% higher
90          90% of values lower and 10% higher
The 50th percentile is our old friend the median. The 25th and 75th percentiles are used quite often in everyday descriptions of data distributions and are usually referred to as the “lower quartile” and “upper quartile” of a distribution.
So how do percentiles help us in giving a meaningful range for the depth of earthquakes below Lake Taupō? The 25th and 75th percentiles are 5.1 km and 9.0 km, respectively (rounded to one decimal place). That means that 50% (half) of the earthquake depths (75% - 25% = 50%) lie between 5.1 km and 9.0 km. This is often called the “inter quartile range”. Saying that 50% of something lies between A and B is easier to understand for most people.

Mean and median depths (left) and median plus lower quartile (25-) and upper quartile (75-) (right).
But 25th and 75th percentiles don’t give a good measure of the spread of earthquake depths because there are too many earthquakes shallower than the 25th percentile, and too many deeper than the 75th. We need more extreme percentiles to capture those. In the end, we chose to use the 5th and 95th percentiles, meaning that 90% of all earthquake depths were within the depth range we stated. The 5th percentile is 3.9 km and the 95th is 12.7 km.
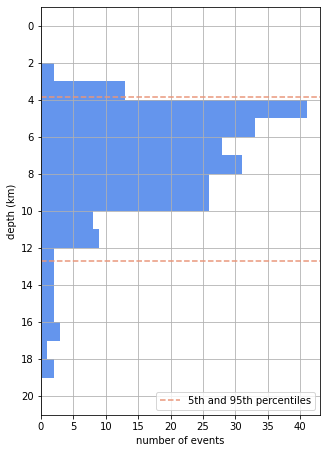
The 5th and 95th percentiles. Used by the VMG in describing the depth of earthquakes beneath Lake Taupō.
You can see that the 5th and 95th percentiles aren’t a perfect fit to the distribution, probably caused by the long tail of deeper earthquakes we mentioned earlier. In the end, the final choice of what percentiles to use is still a little subjective.
Finally, we took the depths of 3.9 km and 12.7 km and rounded those yet further to 4 km and 13 km and said that earthquakes were “mainly at a depth of 4 to 13 km beneath the lake”. You’ll notice that we didn’t explain that we’d used the 5th and 95th percentiles of the depth distribution as that is probably a little complicated coming without all the explanation here.
That’s it for now
So, there you have it. It took quite some consideration to arrive at a seemingly straightforward statement about earthquake depths. The key thing here was for the VMG to have a simple, easy to understand statement about the depth distribution and to be able to explain what it meant if asked. There probably other cases where we can dig down into simple data statements and we might do that in future blogs. You can find our earlier blog posts through the News tab on our web page just select the Data Blog filter before hitting the Search button.
We welcome your feedback, and if there are any GeoNet data topics you’d really like us to talk about, please let us know!
Ngā mihi nui.
Contact: info@geonet.org.nz