M 6.6 Lake Grassmere Fri, Aug 16 2013
This earthquake followed the magnitude 6.5 Cook Strait earthquake on 21st July. It caused damage to buildings on both sides of Cook Strait.
- Magnitude: MW 6.6
Summary
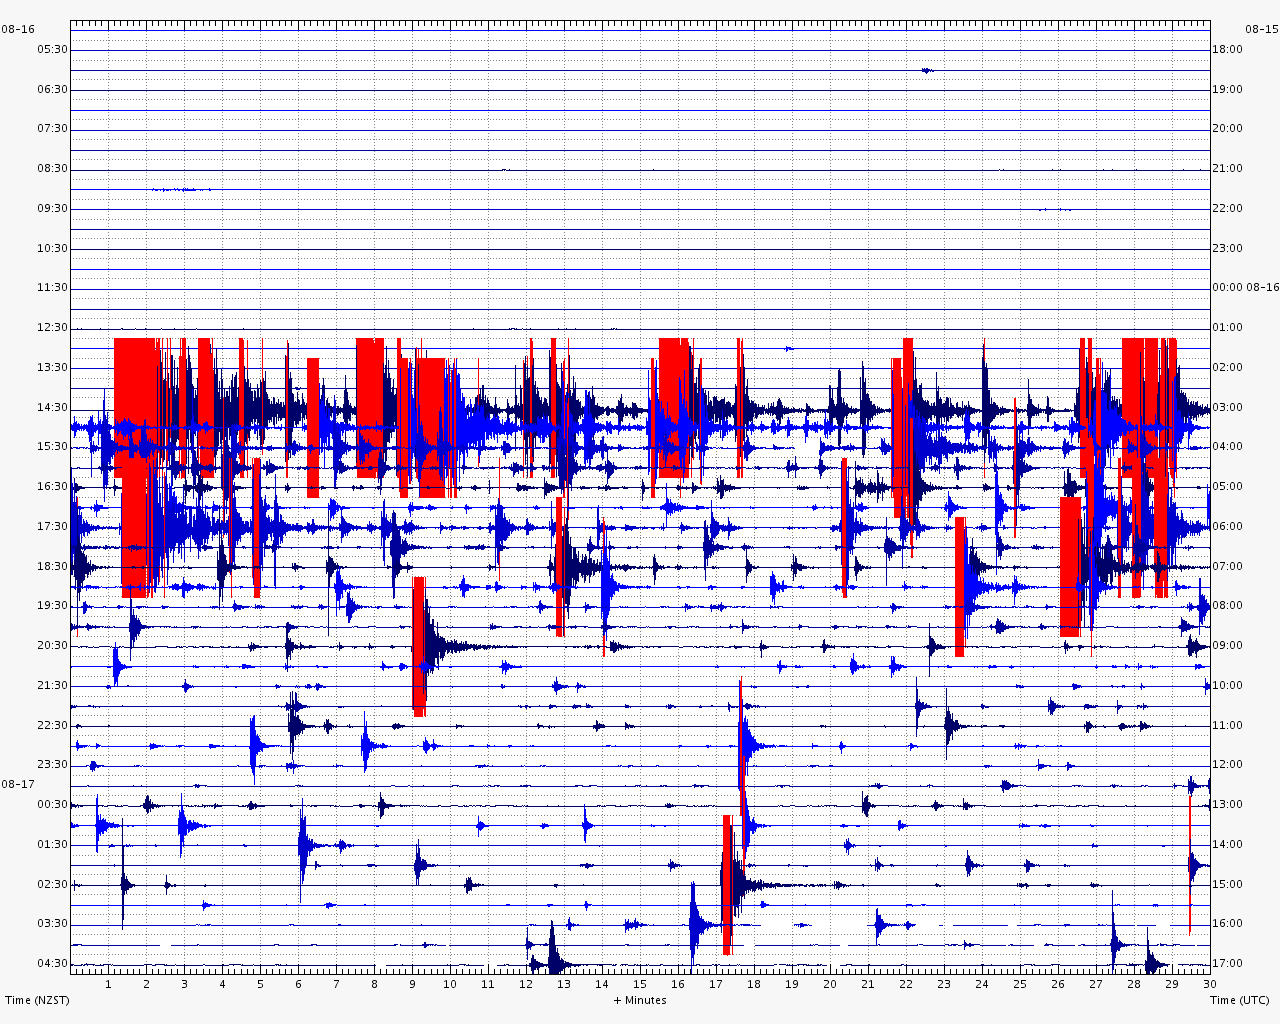
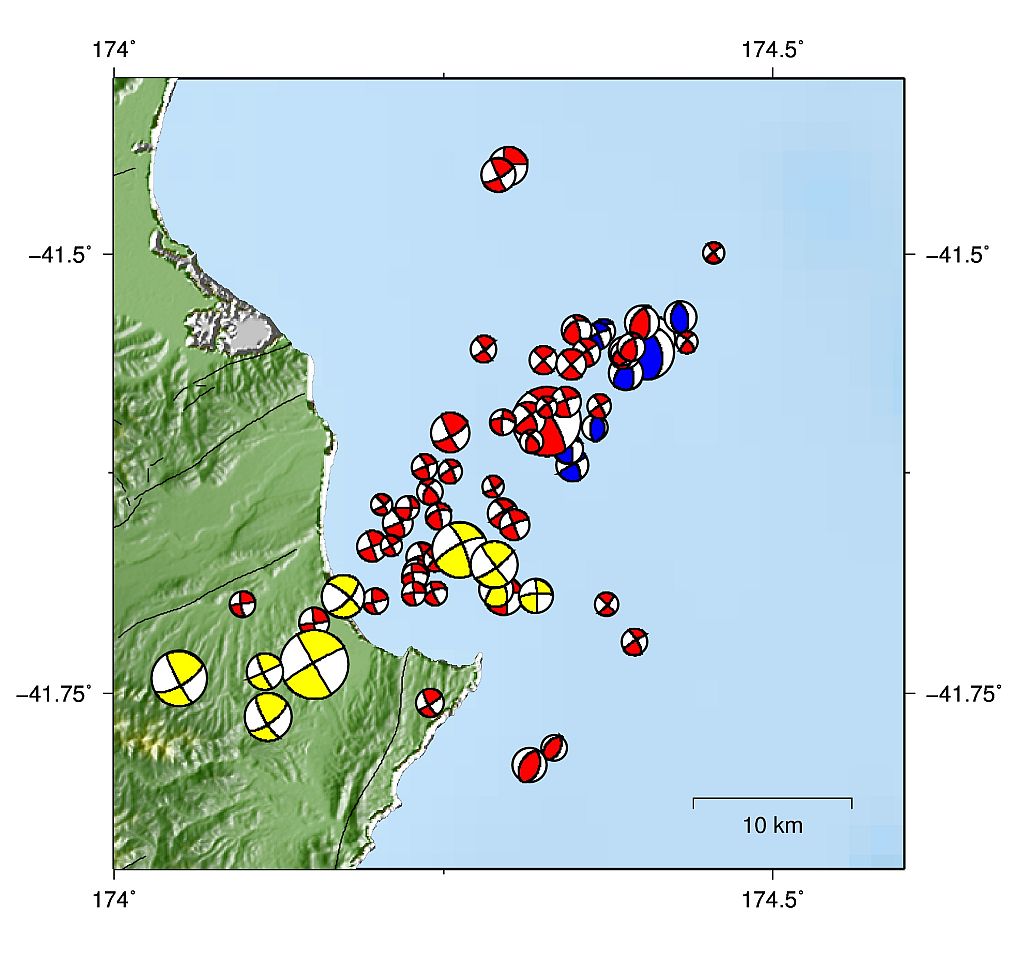
The Lake Grassmere earthquake had a magnitude of 6.6. It occurred just after 2:30 pm on a Friday afternoon, and was centred 8 km under the north-east of the South Island. The focal mechanism shows it to be a strike-slip earthquake, similar to the M6.5 earthquake in the previous month. Two similarly-sized earthquakes with the same sort of characteristics are termed a "doublet".
The aftershock sequence included one of magnitude 6 and several over magnitude 5. We regularly updated the aftershock forecast for central New Zealand until June 2014, when probabilities had returned to pre-July 2013 levels.
GeoNet response
- Seismometers had already been deployed after the July earthquake, and these recorded this sequence as well. Lara Bland, Caroline Hall and Daniel Whitaker installed four further instruments in the week following the Lake Grassmere earthquake, as well as changing batteries and collecting data from the current instruments.
- Russ van Dissen from GNS Science and Tim Little form Victoria University of Wellington conducted a ground reconnaissance over the days following the quake. No evidence of liquefaction was found, nor any sign of surface faulting - see below for further observations.
- A landslide overflight and a survey of any liquefaction was flown on Tuesday 20th and Wednesday 21st August by the team of Chris Massey, Dougal Townsend and Nick Perrin - see below for observations.
- Garth Archibald and Graham Hancox checked for any ground damage in the Wellington port area.
- Neville Palmer and Will Ries re-occupied GPS marks in the area in the week following the earthquake.
Current research
Movement along the fault beneath the earth's surface. Movement is represented by the coloured patch.
As more data comes in, researchers at GNS Science gain a better understanding of how the fault ruptured in the magnitude 6.6 earthquake on Friday afternoon 16th August, and more importantly how the earthquake sequence affects the crust in the region.
Data analysed from 28 of GeoNet’s GPS stations tell us how the land shifted during the large quake; this lets us see what happened kilometres beneath the earth’s surface. Using these data we can reconstruct the complex movement within the earth.
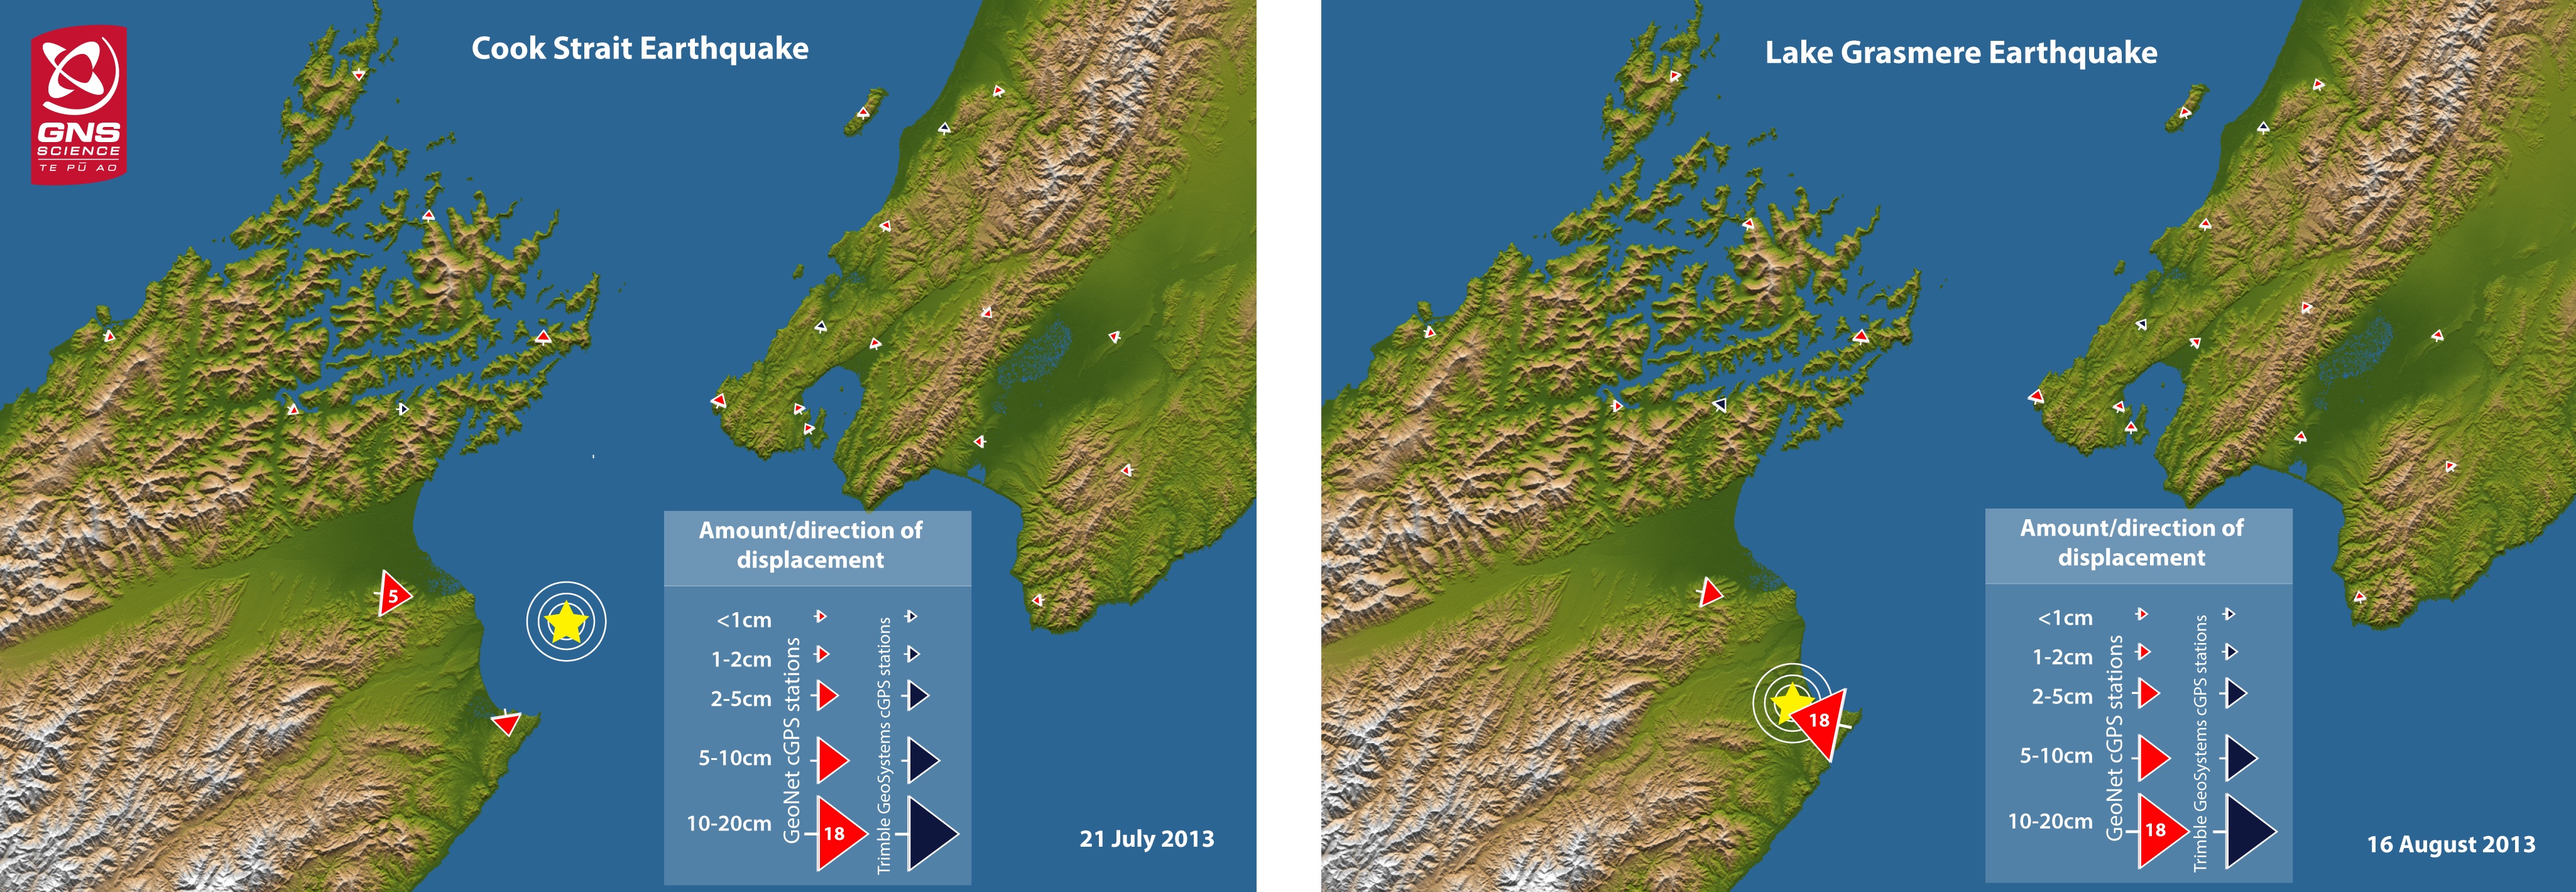
The largest land shift was recorded at Cape Campbell, land here moved 18 cm to the west. The movement of the land during each earthquake is shown in the image below. Beneath the earth's surface, the maximum movement on the fault is approximately 3m which occurred 8km below Lake Grassmere. As the image to the right shows, the fault movement is spread over an area 10km in length; this extends from 4km to 14km below the earth’s surface. Observations by our geologists on the ground confirm that the fault did not reach the surface, as they did not find any evidence of a surface expression.
Just like many things in nature, no two earthquakes are the same. In comparison to the July magnitude 6.5 earthquake, Friday’s quake had a more concentrated rupture. The maximum movement was more than twice that of the 21st July quake, however, the total area of fault rupture was much smaller.
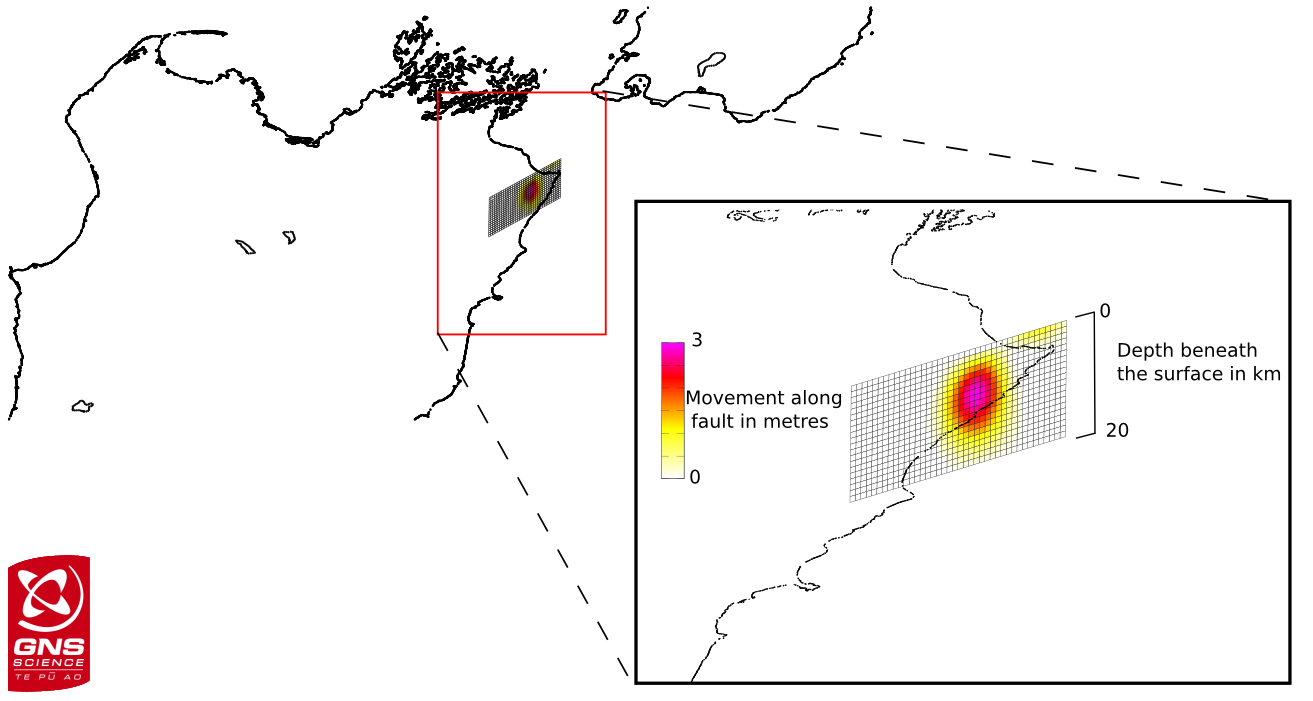
Movement along the fault beneath the earth's surface. Movement is represented by the coloured patch.

This research is very much a work in progress, and part of a much larger research effort into the affected region. Data gathering is still on-going and complementary tools are used to help to piece together the complex mechanics of what happened. Satellite images obtained by the German ‘TerraSAR-X’ satellite that fly over New Zealand, are adding another piece to the puzzle. Researchers are able to compare a ‘before’ and ‘after’ satellite image and see how the earth has moved.
Engineering
The available strong motion data products for Lake Grassmere earthquake, together with plots of seismic waveforms and response spectra, are available from the GeoNet strong-motion site. Through the GeoNet API, a summary information of station peak motions for this event is also available (https://api.geonet.org.nz/intensity/strong/processed/2013p613797).
Geology Reconnaissance Trips
Land-based reconnaissance
The morning after the Grassmere earthquake, Russ Van Dissen (GNS Science) and Professor Tim Little (Victoria University of Wellington) headed south from Wellington to undertake a land-based geology reconnaissance of the epicentral area.
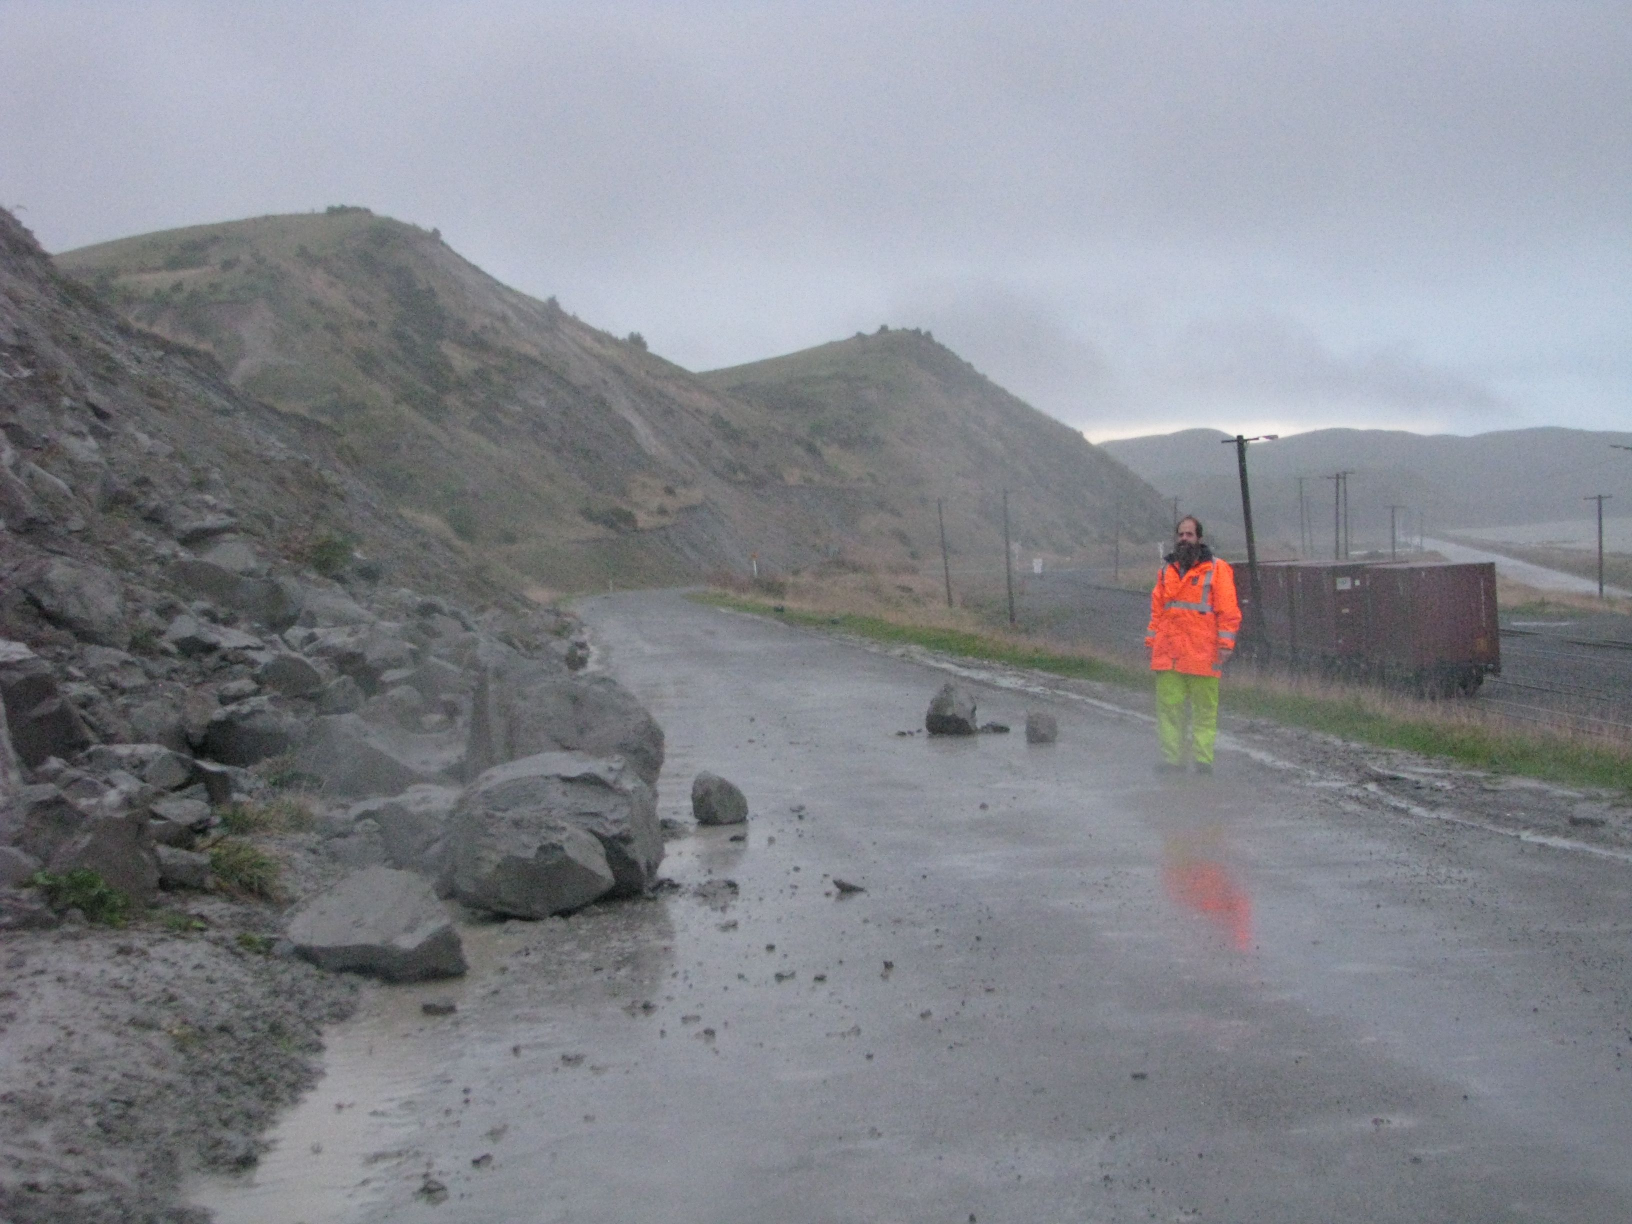
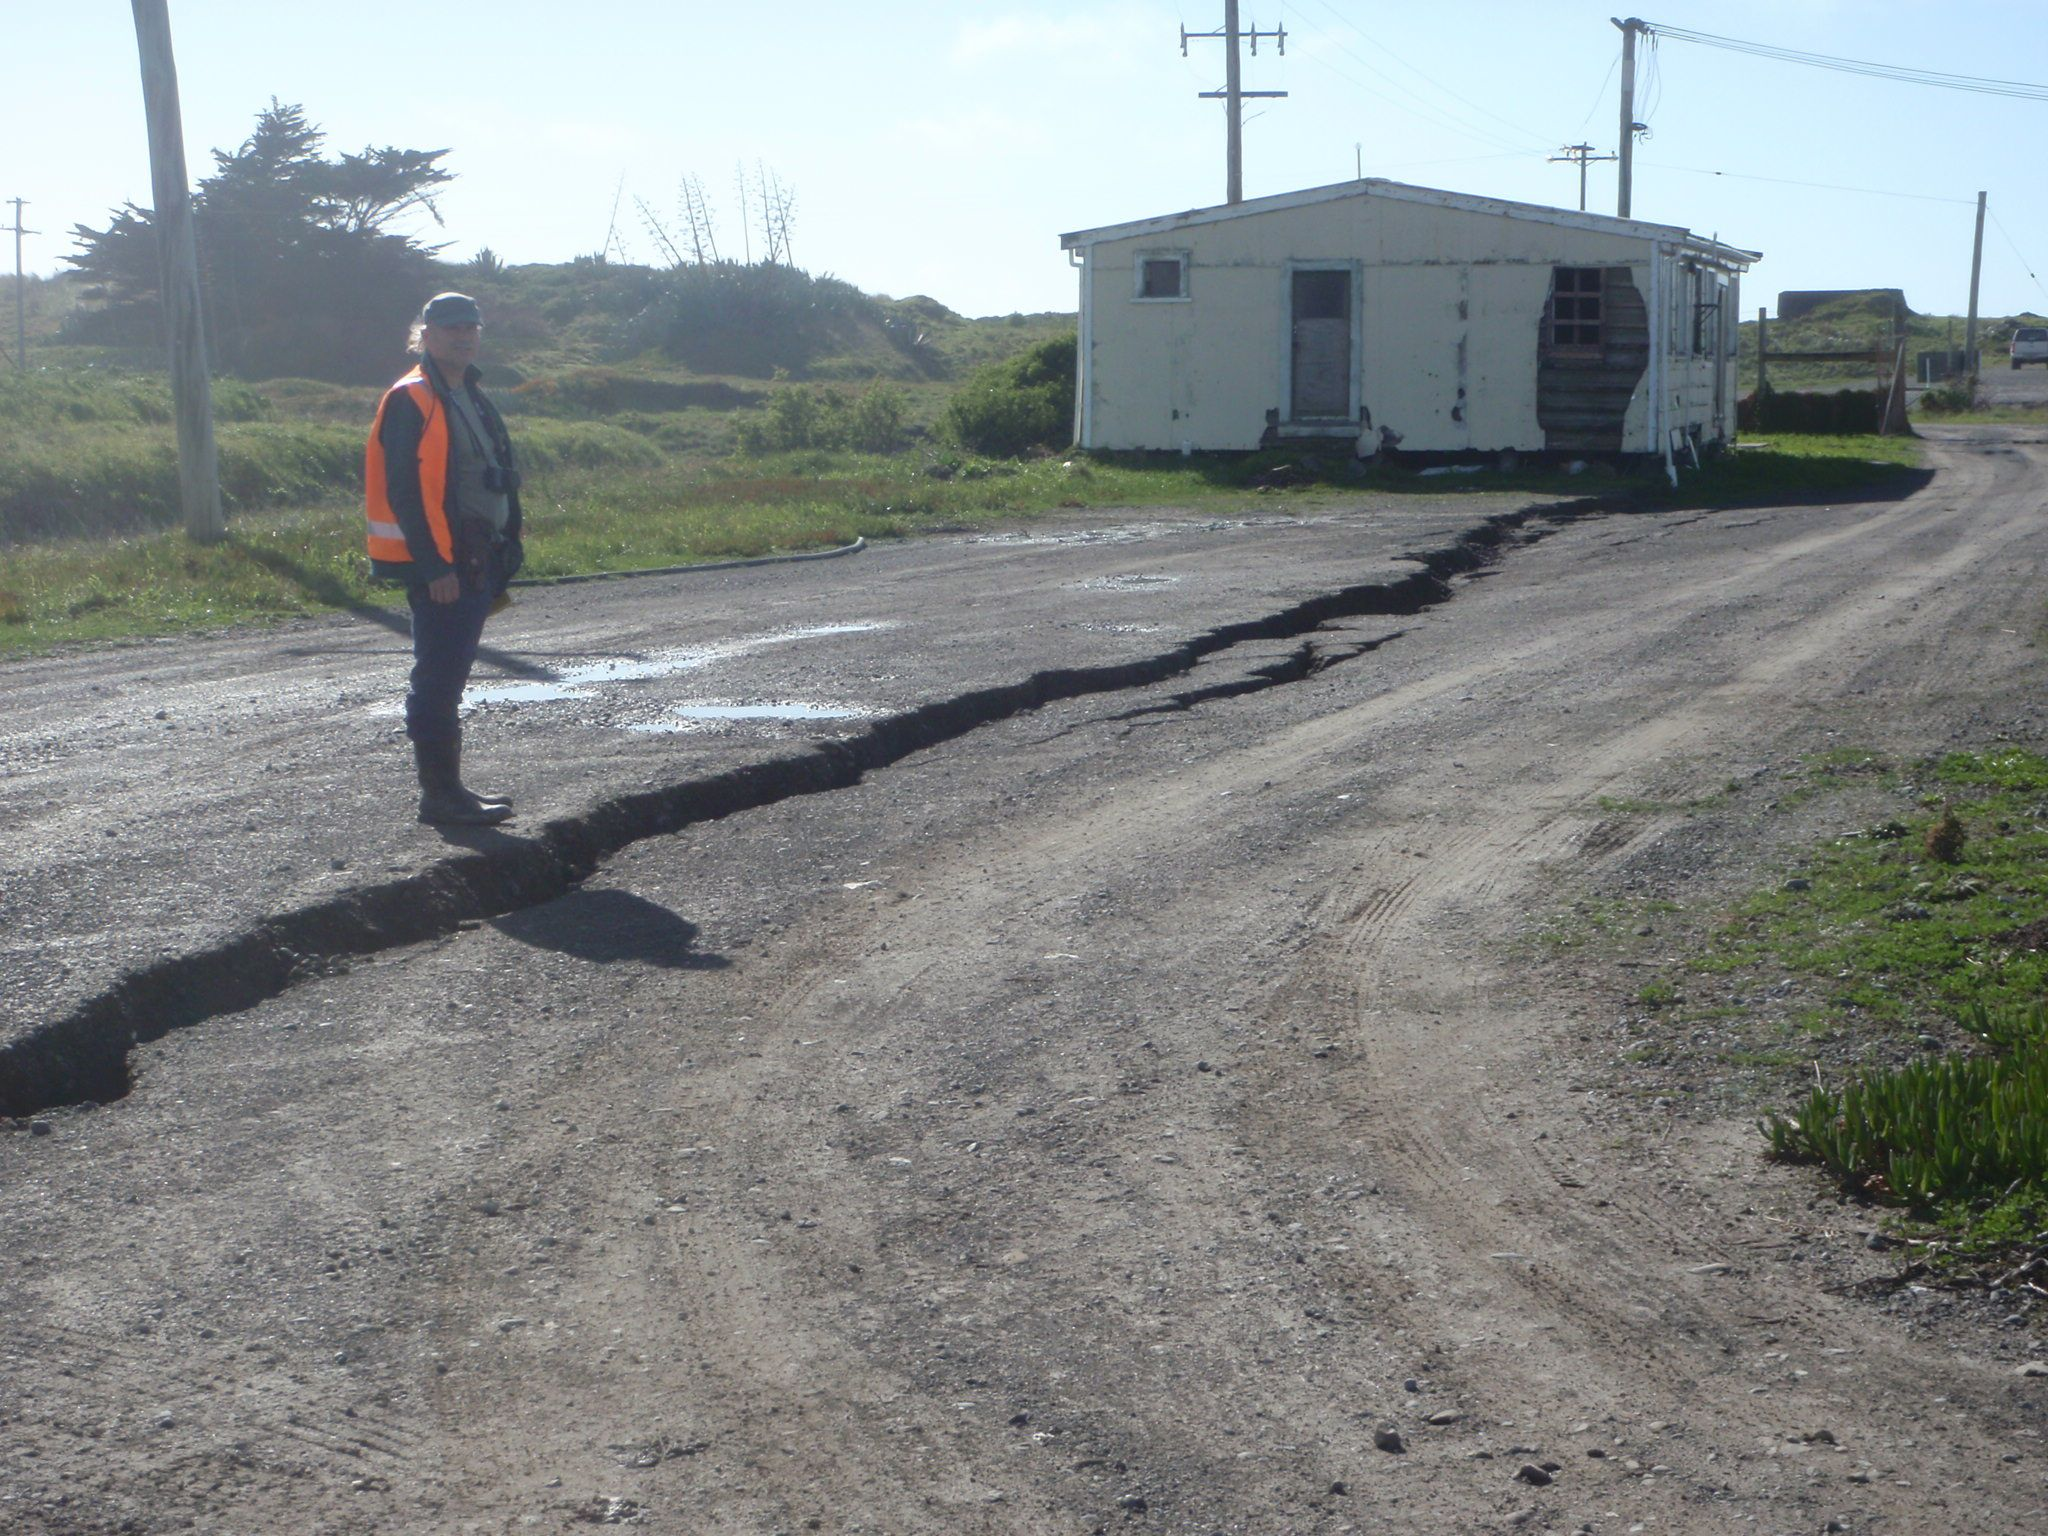
A primary objective was to look for evidence, or otherwise, of ground-surface fault rupture. If the fault that ruptured in the Lake Grassmere earthquake extended to the ground surface, it would cut across State Highway 1 and the Main North Railway near Lake Grassmere. After detailed examination of the State Highway and the railway, as well as other roads, Tim and Russ concluded that there was no evidence at all that the fault broke to the ground surface. They found cracking and slumping of the State Highway and other roads, but this was invariably the result of failure of unsupported embankment slopes, and differential settlement of artificial fill at bridge abutments, over culverts, and at contacts with harder bedrock.
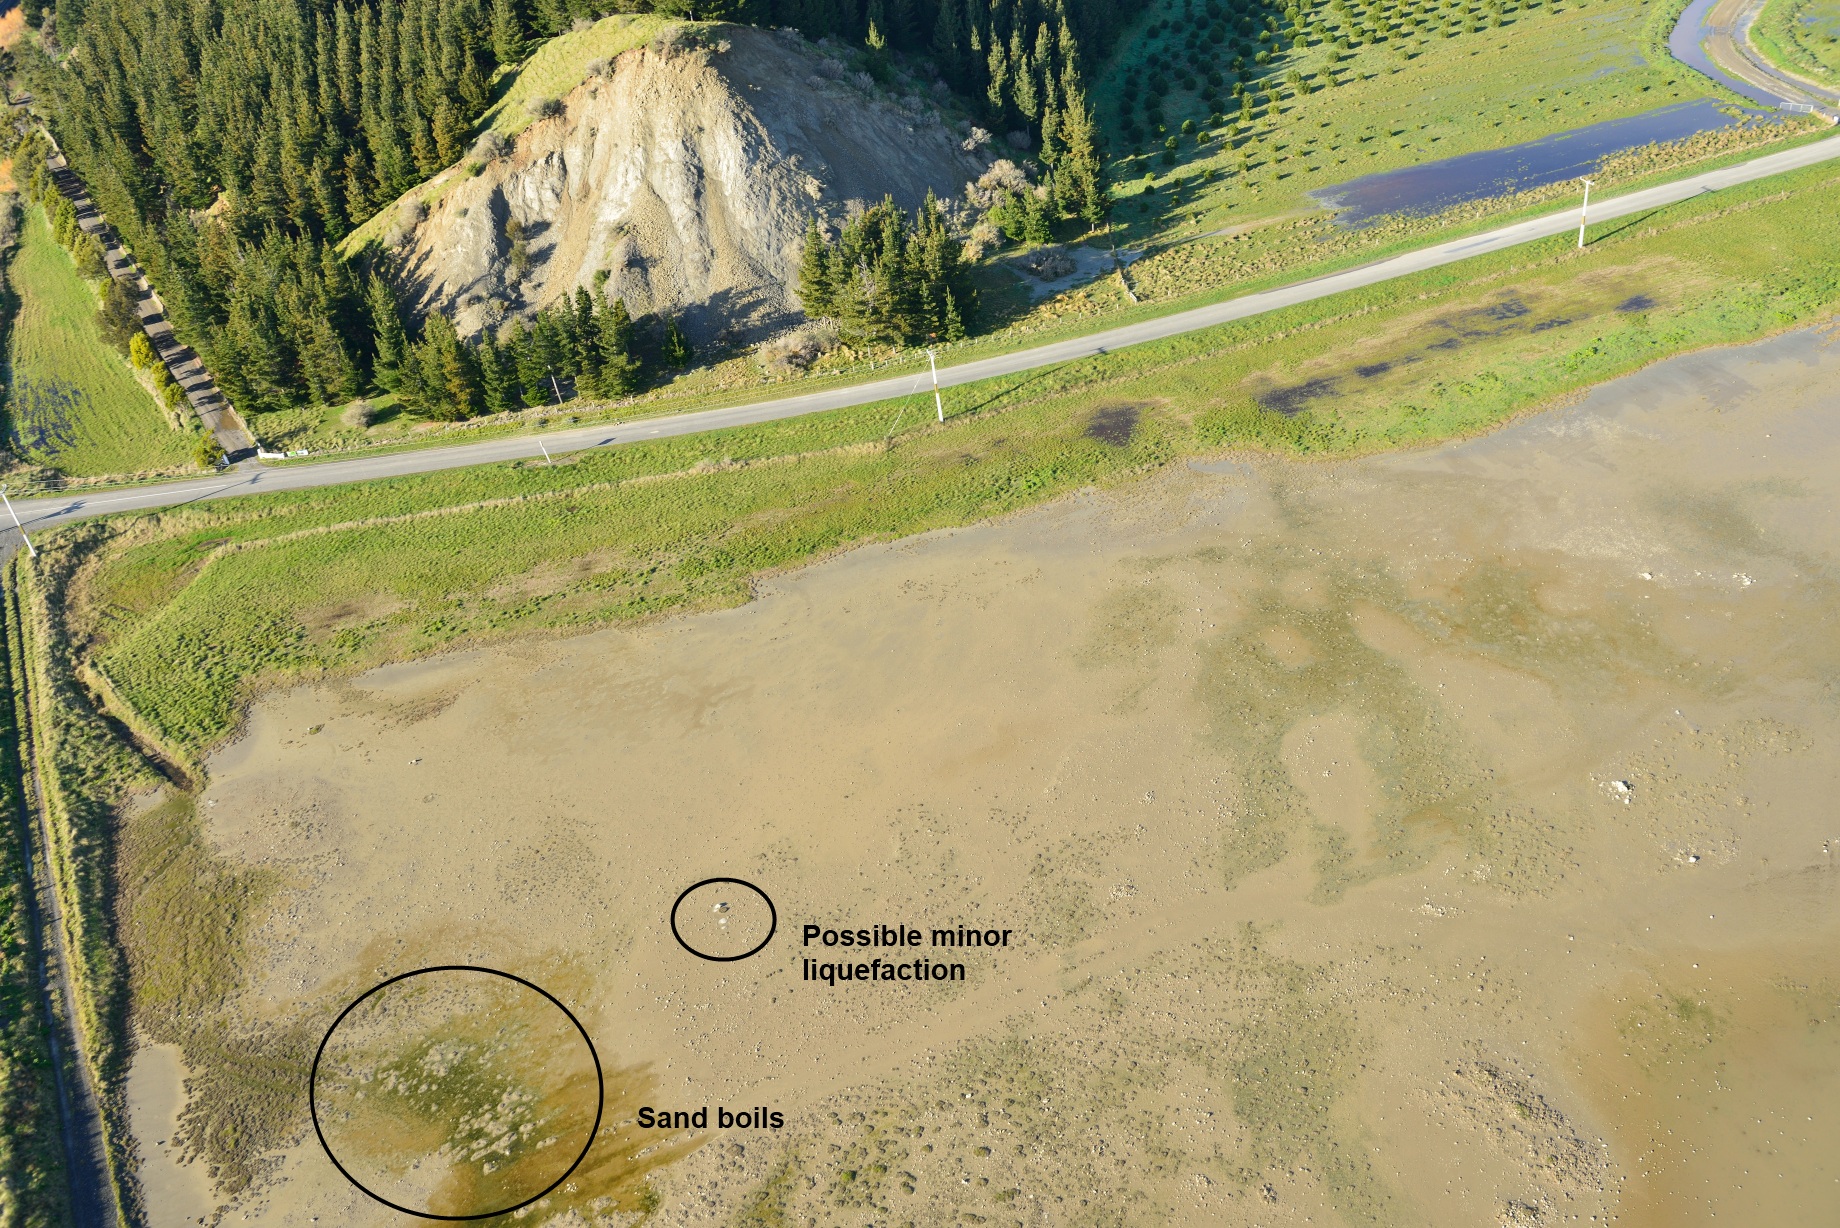
Another objective was to look for signs of liquefaction – especially given the experiences in Christchurch where extensive liquefaction was triggered in low-lying areas during several earthquakes of the 2010-2011 Canterbury earthquake sequence that were of a lesser magnitude compared to the Lake Grassmere earthquake. Russ and Tim examined the low lying and coastal areas around Lake Grassmere, and the Wairau, Awatere, Blind and Flaxbourne rivers. Surprisingly, little – if any – evidence for liquefaction was identified.
Air-based reconnaissance
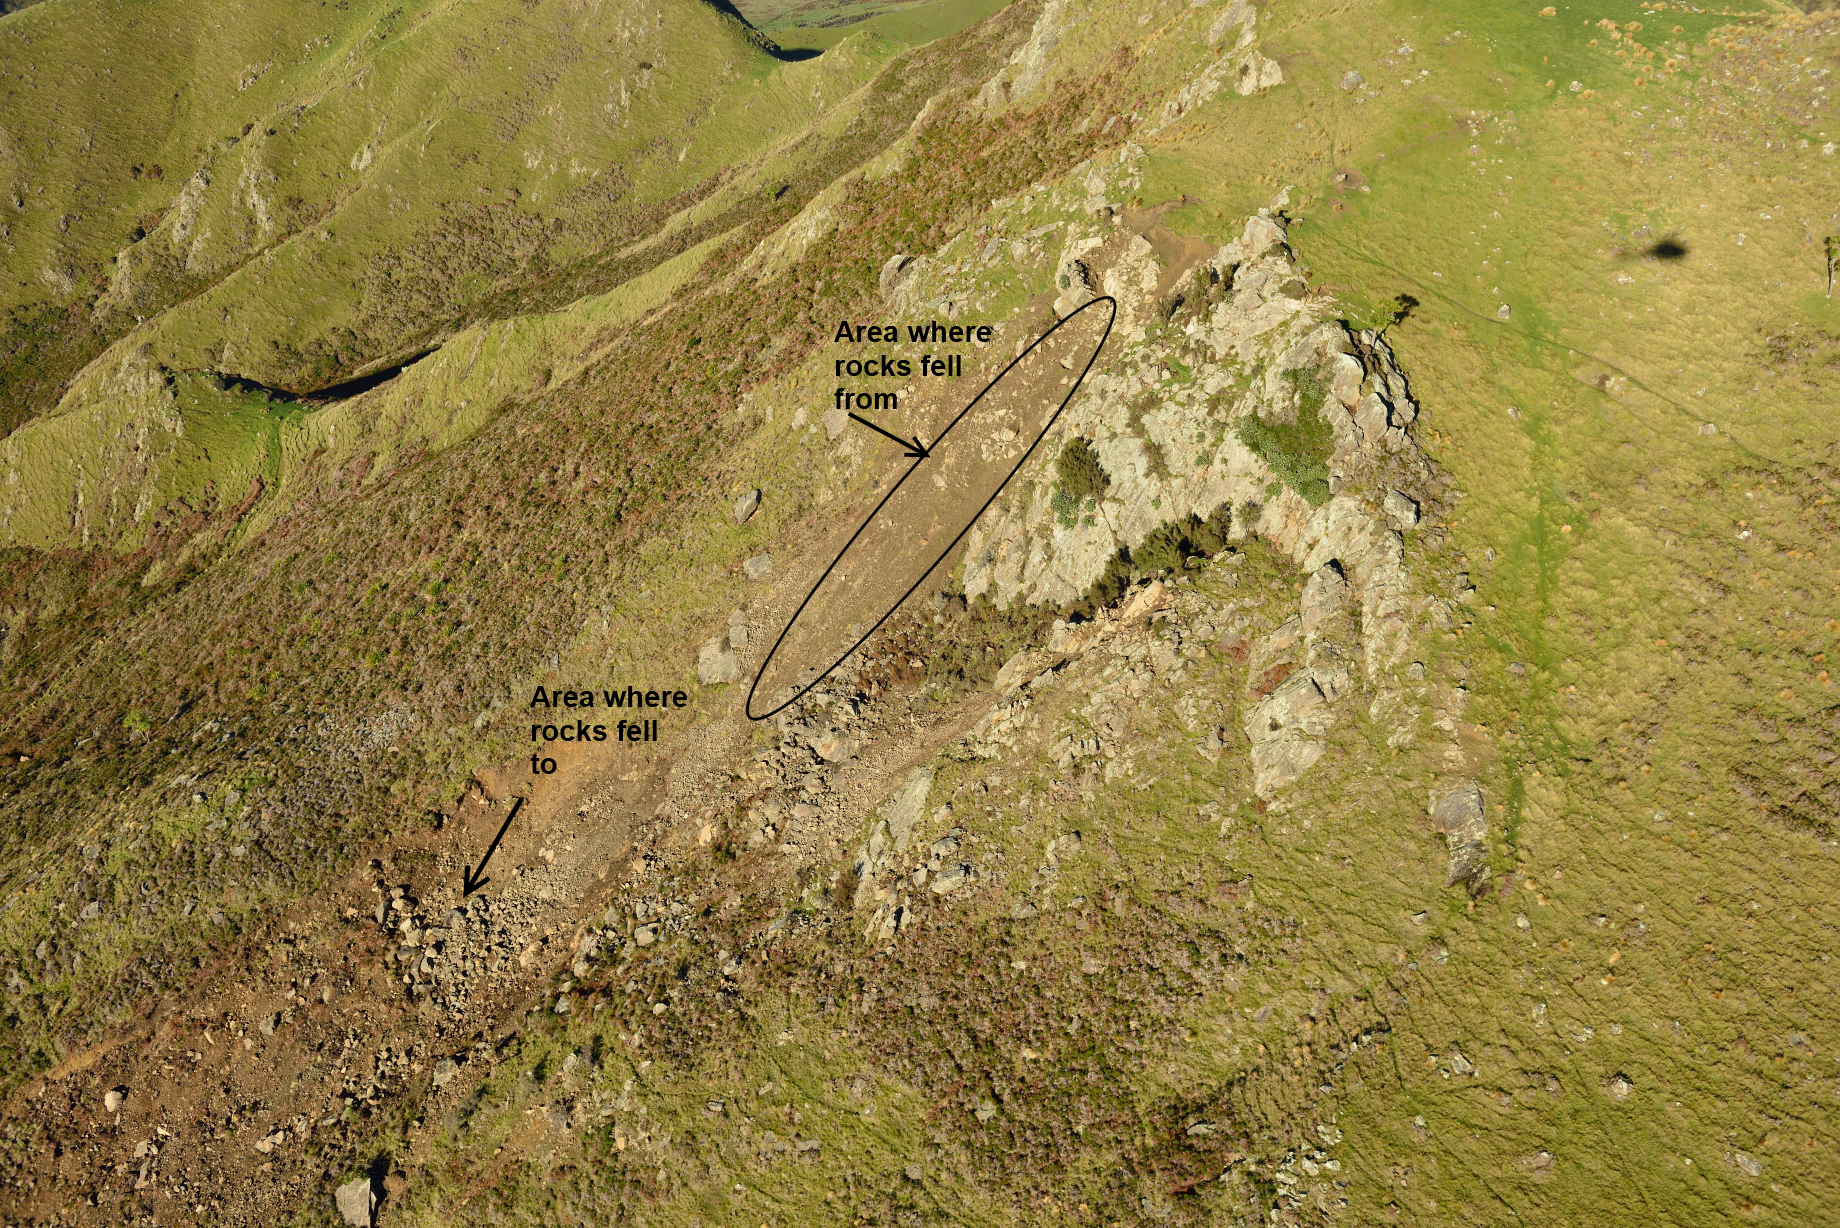
A helicopter reconnaissance by GNS staff members was undertaken on 20th and 21st August to assess any new ground damage after the 16th August Lake Grassmere earthquake. Only minor signs of liquefaction were apparent, mainly on southern side of Lake Grassmere. There were also only minor reactivations of previous landslides on the cliffs of White Bluffs and Cape Campbell to Lake Grassmere with no new significant landslides observed. A slight increase in the number and size of new and reactivated landslides on the coast south of Cape Campbell was observed. The most significant finding from the flight was in the Haldon Hills area around the Flaxbourne River near Ward, where new cracks on ridge crests (“ridge rents”) and terrace edges, many new landslides and large displaced boulders were noted.
